Managing Editor’s Note: With a special type of AI that’s used by Google, NVIDIA, OpenAI, and Elon Musk, our friend, tech investing expert Jeff Brown, has uncovered a new opportunity in the crypto market. He says it could help you make six figures in the next 60 days. He’ll give you all the details during a strategy session on Thursday, November 20, at 8 p.m. ET. If you’d like to attend, just RSVP with one click here. Is the Sell-Off Just Starting? By Larry Benedict, editor, Trading With Larry Benedict Last Thursday, President Trump signed a short-term funding bill that ended the longest U.S. government shutdown in history. But instead of celebrating, investors responded by selling stocks. A big single-day plunge hit some of the stock market’s biggest names, including several members of the “Magnificent Seven.” Some popular AI stocks were hit harder than others. Meta Platforms (META) is 23% off its peak, while Palantir (PLTR) is 16% off its record high. That pullback has the S&P 500 and Nasdaq once again testing the 50-day moving average… a level that neither index has closed below since recovering from the trade war sell-off. Now investors are wondering if support at the 50-day will hold once again… or if it will fail for the first time in over six months. To see if there is more downside in store, one key volatility measure can offer us a view of what’s ahead… A Repeating Pattern The S&P 500 has spent more than 130 consecutive trading sessions above the 50-day MA. That’s the longest streak since 2007. But before you assume the rally will continue, you need to keep an eye on the CBOE Volatility Index (VIX). The VIX reports expected volatility in the S&P 500. It’s a broad measure of volatility across the market and is referred to as Wall Street’s “fear gauge.” That’s because the VIX often spikes higher when the S&P 500 is selling off, and it falls when the S&P 500 is rising steadily. Take a look at the VIX chart over the past year: 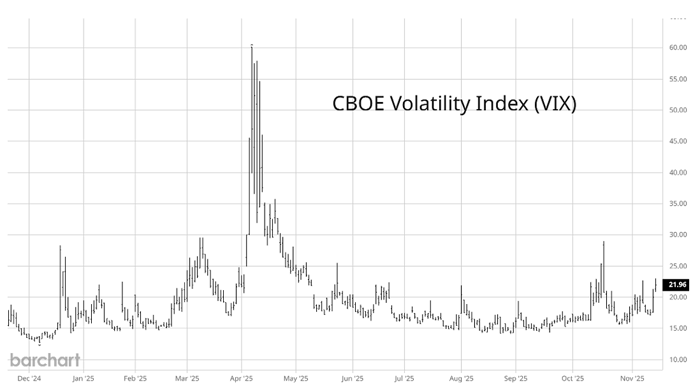
(Click here to expand image) During the initial round of the trade war, the VIX soared to 60 in early April, while the S&P 500 fell as much as 21% from the February peak earlier in the year. The VIX closed at its highest level since the pandemic in 2020. Since then, the VIX has fallen as the S&P 500 rebounded and rose steadily higher. But spikes in the VIX don’t happen without warning. The VIX often reveals a pattern before sudden pullbacks in the stock market. And now that same VIX pattern is showing up once again. So you shouldn’t think the pullback is over just yet… Here’s the VIX pattern that could once again spell trouble for the stock market. Tune in to Trading With Larry Live 
Each week, Market Wizard Larry Benedict goes live to share his thoughts on what’s impacting the markets. Whether you’re a novice or expert trader, you won’t want to miss Larry’s insights and analysis. Even better, it’s free to watch. Simply visit us on YouTube at 8:30 a.m. ET, Monday through Thursday, to catch the latest. | A Worrying Volatility Trend The surprise sell-off last week occurred alongside a jump in the VIX. But it’s just the latest rise in a worrying trend developing since the summer months. After bottoming out in August near the 14 level, the VIX has been making a series of higher lows. Take a look at the chart below: 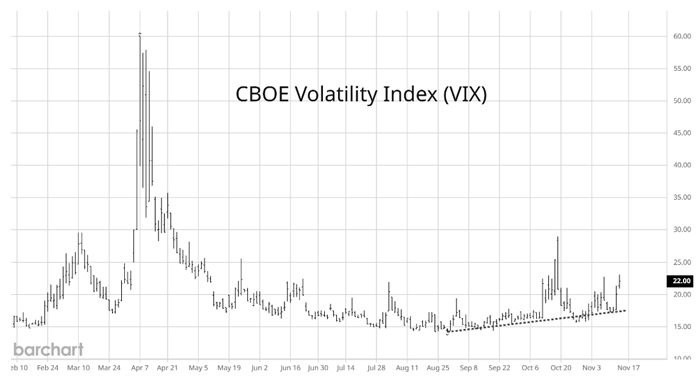
(Click here to expand image) We’ve seen a couple of VIX spikes over that time, but each drop after a spike has been smaller, as you can see with the upward-sloping trendline. That echoes past episodes where building volatility eventually gives way to a sudden burst, along with sharp downside in the S&P 500. The VIX showed a similar pattern heading into the sell-off during the initial rounds of the trade war. Here’s the VIX earlier this year: 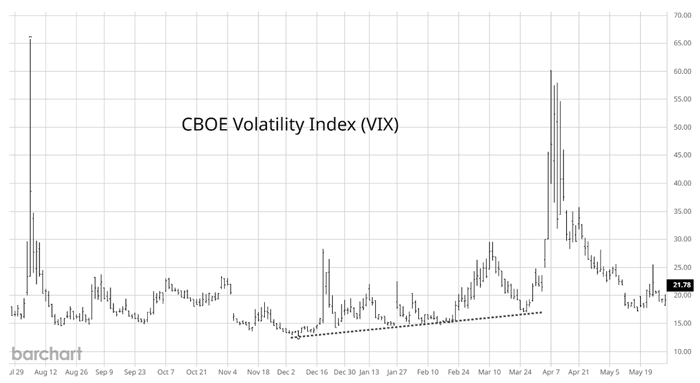
(Click here to expand image) Even before the trade war headlines hit, you can see how the higher lows in VIX showed building pressure on volatility levels. We have plenty of headlines to drive another round of volatility. So whichever narrative emerges, don’t say you weren’t without warning… Happy Trading, Larry Benedict
Editor, Trading With Larry Benedict Free Trading Resources Have you checked out Larry’s free trading resources on his website? It contains a full trading glossary to help kickstart your trading career – at zero cost to you. Just click here to check it out. | | 


0 Response to "Is the Sell-Off Just Starting?"
Post a Comment