Internet Content Giant Trending Up

 ‌ ‌ ‌ ‌ ‌ ‌ ‌ ‌ ‌ ‌ ‌ ‌ ‌   ‌ ‌ ‌ ‌ ‌ ‌ ‌ ‌ ‌ ‌ ‌ ‌ ‌   ‌ ‌ ‌ ‌ ‌ ‌ ‌ ‌ ‌ ‌ ‌ ‌ ‌   ‌ ‌ ‌ ‌ ‌ ‌ ‌ ‌ ‌ ‌ ‌ ‌ ‌   ‌ ‌ ‌ ‌ ‌ ‌ ‌ ‌ ‌ ‌ ‌ ‌ ‌   ‌ ‌ ‌ ‌ ‌ ‌ ‌ ‌ ‌ ‌ ‌ ‌ ‌   ‌ ‌ ‌ ‌ ‌ ‌ ‌ ‌ ‌ ‌ ‌ ‌ ‌   ‌ ‌ ‌ ‌ ‌ ‌ ‌ ‌ ‌ ‌ ‌ ‌ ‌   ‌ ‌ ‌ ‌ ‌ ‌ ‌ ‌ ‌ ‌ ‌ ‌ ‌   ‌ ‌ ‌ ‌ ‌ ‌ ‌ ‌ ‌ ‌ ‌ ‌ ‌   ‌ ‌ ‌ ‌ ‌ ‌ ‌ ‌ ‌ ‌ ‌ ‌ ‌   ‌ ‌ ‌ ‌ ‌ ‌ ‌ ‌ ‌ ‌ ‌ ‌ ‌   ‌ ‌ ‌ ‌ ‌ ‌ ‌ ‌ ‌ ‌ ‌ ‌ ‌   ‌ ‌ ‌ ‌ ‌ ‌ ‌ ‌ ‌ ‌ ‌ ‌ ‌ 
Chuck's Trade of the Day

April 29th, 2021

Internet Content Giant Trending Up

Dear Reader,

Yesterday, we looked at a Monthly Price Chart of Mid-America Apartment Communities Inc., noting the stock’s 1-Month Price is trading above the 10-Month SMA signaling a ‘Buy’.

For today’s Trade of the Day we will be looking at an On Balance Volume chart for Alphabet Inc. stock symbol: GOOGL.

Before breaking down GOOGL’s OBV chart let’s first review which products and services are offered by the company.

Alphabet Inc. provides online advertising services in the United States, Europe, the Middle East, Africa, the Asia-Pacific, Canada, and Latin America. The company offers performance and brand advertising services. It operates through Google Services, Google Cloud, and Other Bets segments. The Google Services segment provides products and services, such as ads, Android, Chrome, hardware, Google Maps, Google Play, Search, and YouTube, as well as technical infrastructure; and digital content.

Confirming a Price Uptrend with OBV

The GOOGL daily price chart below shows that GOOGL is in a price uptrend as the current price is above the price GOOGL traded at six months ago (circled). The On Balance Volume chart is below the daily chart.

On Balance Volume measures volume flow with a single Easy-to-Read Line. Volume flow precedes price movement and helps sustain the price uptrend. When a stock closes up, volume is added to the line. When a stock closes down, volume is subtracted from the line. A cumulative total of these additions and subtractions form the OBV line.

On Balance Volume Indicator

● When Close is Up, Volume is Added

● When Close is Down, Volume is Subtracted

● A Cumulative Total of Additions and Subtractions form the OBV Line

Volume flow precedes price and is the key to measuring the validity and sustainability of a price trend. 

We can see from the OBV chart below that the On Balance Volume line for GOOGL is sloping up. An up-sloping line indicates that the volume is heavier on up days and buying pressure is exceeding selling pressure. Buying pressure must continue to exceed selling pressure in order to sustain a price uptrend. So, On Balance Volume is a simple indicator to use that confirms the price uptrend and its sustainability.

The numerical value of the On Balance Volume line is not important. We simply want to see an up-sloping line to confirm a price up trend.

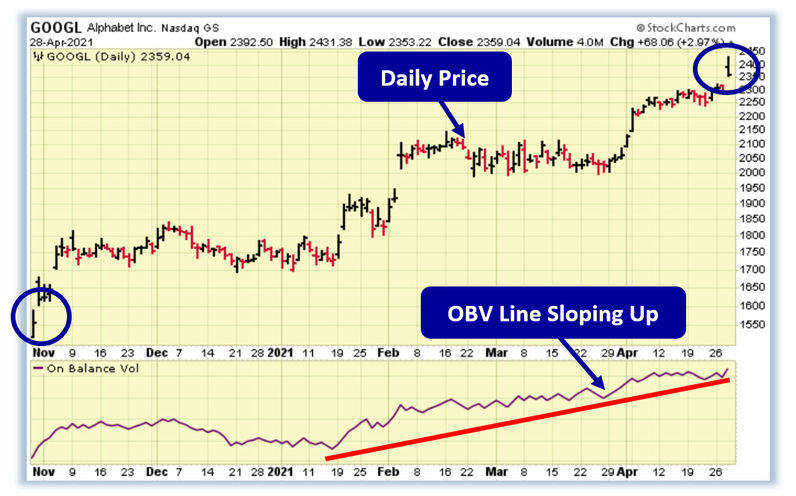
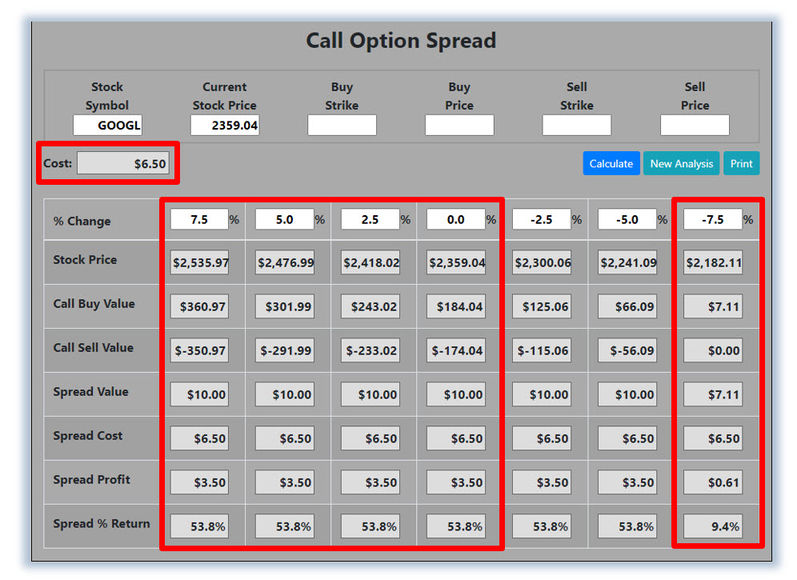
Confirmed ‘Buy’ Signal for GOOGL

Since GOOGL's OBV line is sloping up, the most likely future price movement for GOOGL is up, making GOOGL a good candidate for a stock purchase or a debit spread trade.

Let's use the Hughes Optioneering calculator to look at the potential returns for a GOOGL debit spread.

The Call Option Spread Calculator will calculate the profit/loss potential for a call option spread based on the price change of the underlying stock/ETF at option expiration in this example from a 7.5% increase to a 7.5% decrease in GOOGL stock at option expiration.

The goal of this example is to demonstrate the ‘built in’ profit potential for option spreads and the ability of spreads to profit if the underlying stock is up, down or flat at option expiration. Out of fairness to our paid option service subscribers we don’t list the option strike prices used in the profit/loss calculation.

The prices and returns represented below were calculated based on the current stock and option pricing for GOOGL on 4/28/2021 before commissions.

Built in Profit Potential

For this option spread, the calculator analysis below reveals the cost of the spread is $650 (circled). The maximum risk for an option spread is the cost of the spread.

The analysis reveals that if GOOGL stock is flat or up at all at expiration the spread will realize a 53.8% return (circled).

And if GOOGL stock decreases 7.5% at option expiration, the option spread would make a 9.4% return (circled).

Due to option pricing characteristics, this option spread has a ‘built in’ 53.8% profit potential when the trade was initiated.

Option spread trades can result in a higher percentage of winning trades compared to a directional option trade if you can profit when the underlying stock/ETF is up, down or flat.

A higher percentage of winning trades can give you the discipline needed to become a successful trader.

The Hughes Optioneering Team is here to help you identify winning trades just like this one.

Interested in accessing the Optioneering Calculators? Join one of Chuck's Trading Services for unlimited access! The Optioneering Team has option calculators for six different option strategies that allow you to calculate the profit potential for an option trade before you take the trade.

Average Portfolio Return of 188.7%

Below is a screenshot of the current open trade profit results from Chuck’s Inner Circle Trading Service. There are currently $446,968.23 in open trade profits with an average portfolio return of 188.7% demonstrating the ability of the Optioneering Strategy to deliver substantial returns with no losing portfolios.

Become a Member of Chuck's Trading Service

Do you want to start receiving hand-picked trades from 10-Time Trading Champion, Chuck Hughes?

As a Trade of the Day subscriber, Chuck is offering you a special discount on his Inner Circle Trading Service.

Just call Brad at 1-866-661-5664 or 1-310-647-5664 to join and use the code "Optioneering VIP" to receive special pricing!


Wishing You the Best in Investing Success,

Chuck Huges Signature

Chuck Hughes

Editor, Trade of the Day

Have any questions? Email us at dailytrade@chuckstod.com


If you didn't create an account using this email address, please ignore this email or unsubscribe.

To ensure delivery of this email to your inbox and to enable images to load in future mailings, please add todaystrade@chuckstod.com to your e-mail address book or safe senders list.

© 2021 Tradewins Publishing. All rights reserved. The information provided by the newsletters, trading, training and educational products related to various markets (collectively referred to as the "Services") is not customized or personalized to any particular risk profile or tolerance. Nor is the information published by Legacy Publishing, LLC ("Legacy") a customized or personalized recommendation to buy, sell, hold, or invest in particular financial products. Past performance is not necessarily indicative of future results. Trading and investing involve substantial risk and is not appropriate for everyone. The actual profit results presented here may vary with the actual profit results presented in other Legacy Publishing LLC publications due to the different strategies and time frames presented in other publications. Trading on margin carries a high level of risk and may not be suitable for all investors. Other than the refund policy detailed elsewhere, Legacy does not make any guarantee or other promise as to any results that may be obtained from using the Services. Legacy disclaims any and all liability for any investment or trading loss sustained by a subscriber. You should trade or invest only 'risk capital' - money you can afford to lose. Trading stocks and stock options involves high risk and you can lose the entire principal amount invested or more. There is no guarantee that systems, indicators, or trading signals will result in profits or that they will not produce losses. Some profit examples are based on hypothetical or simulated trading. This means the trades are not actual trades and instead are hypothetical trades based on real market prices at the time the recommendation is disseminated. No actual money is invested, nor are any trades executed. Hypothetical or simulated performance is not necessarily indicative of future results. Hypothetical performance results have many inherent limitations, some of which are described below. Also, the hypothetical results do not include the costs of subscriptions, commissions, or other fees. Because the trades underlying these examples have not actually been executed, the results may understate or overstate the impact of certain market factors, such as lack of liquidity. Legacy makes no representations or warranties that any account will or is likely to achieve profits similar to those shown. No representation is being made that you will achieve profits or the same results as any person providing a testimonial. No representation is being made that any person providing a testimonial is likely to continue to experience profitable trading after the date on which the testimonial was provided, and in fact the person providing the testimonial may have subsequently experienced losses. The cost basis for some of the options in a portfolio may be reduced by rolling over profits at option expiration which is one of the Hughes Optioneering Trade Management Rules. Some income figures presented represent the total amount of option premium collected during the referenced period. Actual profits were less. Open trade profit results may have increased or decreased when the trades were closed out. Chuck Hughes' experiences are not typical. Chuck Hughes is an experienced investor and your results will vary depending on risk tolerance, amount of risk capital utilized, size of trading position, willingness to follow the rules and other factors.

You are currently subscribed to tod as: penunggangbadai.moneyblog@blogger.com.
Add todaystrade@chuckstod.com to your email address book to ensure delivery.
Forward to a Friend | Manage Subscription | Subscribe | Unsubscribe | Snooze
                                 

Subscribe to receive free email updates:

0 Response to "Internet Content Giant Trending Up"

Post a Comment