| May 7th, 2021 Buying Pressure Drives TPOR Higher Dear Reader, Yesterday, we looked at a Daily Price Chart of Aflac, Inc. noting the stock’s 50-Day EMA is trading above the 100-Day EMA signaling a ‘Buy’. For today’s Trade of the Day we will be looking at an On Balance Volume chart for Direxion Daily Transportation Bull 3X ETF symbol: TPOR. Before breaking down TPOR’s OBV chart let’s first review the investment objective of the ETF. The TPOR ETF seeks daily investment results of 300% of the daily performance of the Dow Jones Transportation Average. The index measures the performance of large, well-known companies within the transportation industry. Confirming a Price Uptrend with OBV The TPOR daily price chart below shows that TPOR is in a price uptrend as the current price is above the price TPOR traded at six months ago (circled). The On Balance Volume chart is below the daily chart. On Balance Volume measures volume flow with a single Easy-to-Read Line. Volume flow precedes price movement and helps sustain the price uptrend. When a stock closes up, volume is added to the line. When a stock closes down, volume is subtracted from the line. A cumulative total of these additions and subtractions form the OBV line. On Balance Volume Indicator ● When Close is Up, Volume is Added ● When Close is Down, Volume is Subtracted ● A Cumulative Total of Additions and Subtractions form the OBV Line Volume flow precedes price and is the key to measuring the validity and sustainability of a price trend. We can see from the OBV chart below that the On Balance Volume line for TPOR is sloping up. An up-sloping line indicates that the volume is heavier on up days and buying pressure is exceeding selling pressure. Buying pressure must continue to exceed selling pressure in order to sustain a price uptrend. So, On Balance Volume is a simple indicator to use that confirms the price uptrend and its sustainability. The numerical value of the On Balance Volume line is not important. We simply want to see an up-sloping line to confirm a price up trend. 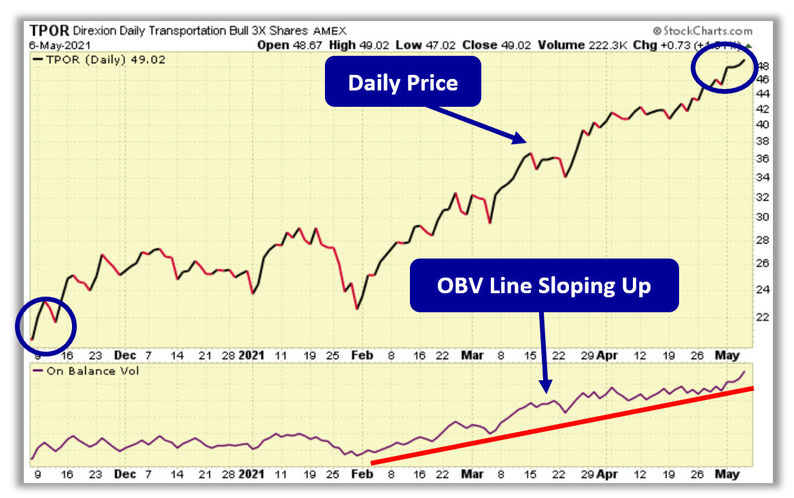
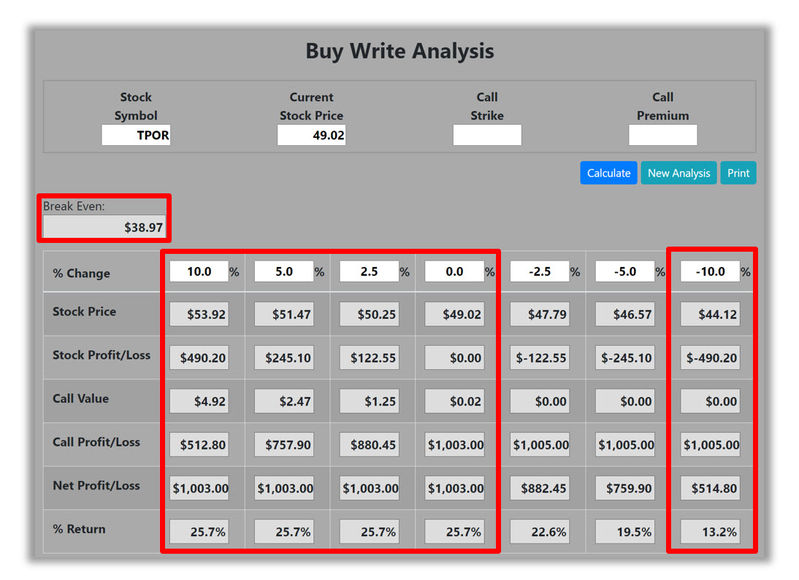
Confirmed ‘Buy’ Signal for TPOR Since TPOR's OBV line is sloping up, the most likely future price movement for TPOR is up, making TPOR a good candidate for an ETF purchase or a covered call trade. Let’s use the Optioneering calculator to look at the potential returns for a TPOR covered call trade. Covered calls are also known as buy writes. The Buy Write Calculator will calculate the profit/loss potential for a covered call trade based on the price change of the underlying stock/ETF at option expiration in this example from a 10% increase to a 10% decrease in TPOR stock at option expiration. The goal of this example is to demonstrate the ‘built in’ profit potential for covered calls and the ability of covered calls to profit if the underlying stock is up, down or flat at option expiration. Out of fairness to our paid option service subscribers we don’t list the option strike price used in the profit/loss calculation. The prices and returns represented below were calculated based on the current stock and option pricing for TPOR on 5/6/2021 before commissions. | 


0 Response to "Buying Pressure Drives TPOR Higher"
Post a Comment