| May 13th, 2021 Buying Pressure Pushes EMN Higher Dear Reader, Yesterday, we looked at a Daily Price Chart of Discover Financial Services, noting the stock’s 50-Day EMA is trading above the 100-Day EMA signaling a ‘Buy’. For today’s Trade of the Day we will be looking at an On Balance Volume chart for Eastman Chemical Co. stock symbol: EMN. Before breaking down EMN’s OBV chart let’s first review which products and services are offered by the company. Eastman Chemical Company operates as a specialty materials company worldwide. The company's Additives & Functional Products segment offers hydrocarbon and rosin resins; organic acid-based solutions; amine derivative-based building blocks; metam-based soil fumigants, thiram and ziram based fungicides, and plant growth regulators; specialty coalescent, specialty and commodity solvents, paint additives, and specialty polymers; heat transfer and aviation fluids; insoluble sulfur and anti-degradant rubber additives; and performance resins. Confirming a Price Uptrend with OBV The EMN daily price chart below shows that EMN is in a price uptrend as the current price is above the price EMN traded at six months ago (circled). The On Balance Volume chart is below the daily chart. On Balance Volume measures volume flow with a single Easy-to-Read Line. Volume flow precedes price movement and helps sustain the price uptrend. When a stock closes up, volume is added to the line. When a stock closes down, volume is subtracted from the line. A cumulative total of these additions and subtractions form the OBV line. On Balance Volume Indicator ● When Close is Up, Volume is Added ● When Close is Down, Volume is Subtracted ● A Cumulative Total of Additions and Subtractions form the OBV Line Volume flow precedes price and is the key to measuring the validity and sustainability of a price trend. We can see from the OBV chart below that the On Balance Volume line for EMN is sloping up. An up-sloping line indicates that the volume is heavier on up days and buying pressure is exceeding selling pressure. Buying pressure must continue to exceed selling pressure in order to sustain a price uptrend. So, On Balance Volume is a simple indicator to use that confirms the price uptrend and its sustainability. The numerical value of the On Balance Volume line is not important. We simply want to see an up-sloping line to confirm a price up trend. 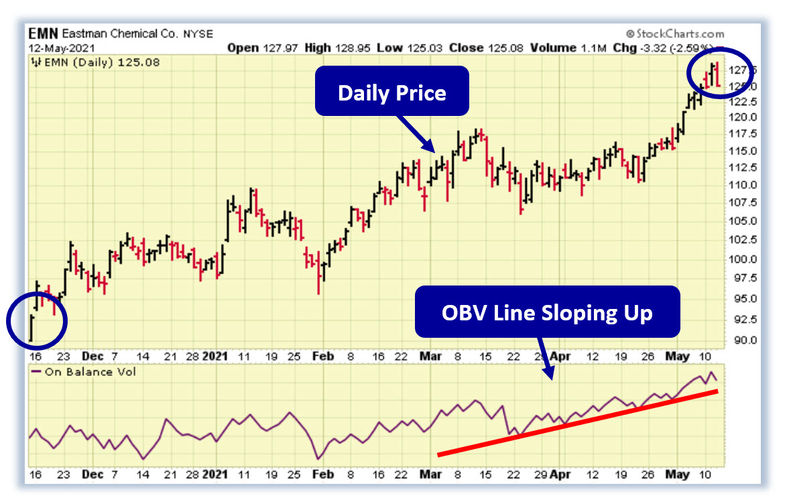
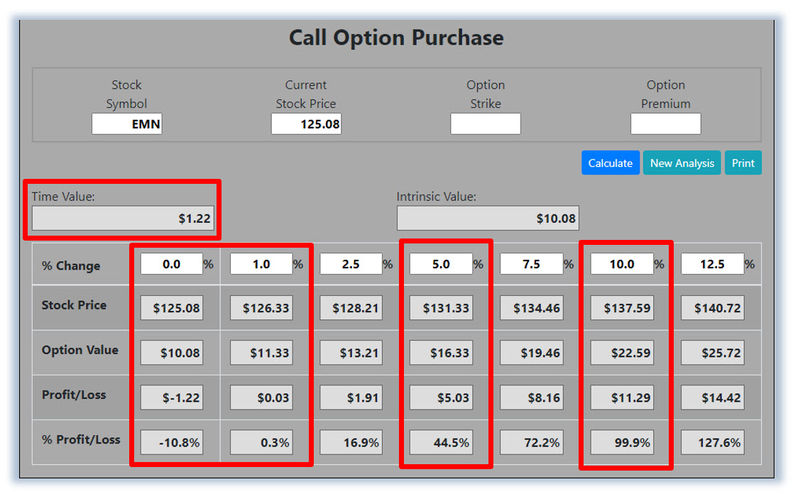
Confirmed ‘Buy’ Signal for EMN Since EMN's OBV line is sloping up, the most likely future price movement for EMN is up, making EMN a good candidate for a stock purchase or a call option purchase. Let's use the Hughes Optioneering calculator to look at the potential returns for an EMN call option purchase. The Call Option Calculator will calculate the profit/loss potential for a call option trade based on the price change of the underlying stock/ETF at option expiration in this example from a flat EMN price to a 12.5% increase. The Optioneering Team uses the 1% Rule to select an option strike price with a higher percentage of winning trades. In the following EMN option example, we used the 1% Rule to select the EMN option strike price but out of fairness to our paid option service subscribers we don’t list the strike price used in the profit/loss calculation. Our initial price target for EMN stock is 132.80 per share. | 


0 Response to "Buying Pressure Pushes EMN Higher"
Post a Comment