Nasdaq ETF Maintains Strong 'Buy' Signal

 ‌ ‌ ‌ ‌ ‌ ‌ ‌ ‌ ‌ ‌ ‌ ‌ ‌   ‌ ‌ ‌ ‌ ‌ ‌ ‌ ‌ ‌ ‌ ‌ ‌ ‌   ‌ ‌ ‌ ‌ ‌ ‌ ‌ ‌ ‌ ‌ ‌ ‌ ‌   ‌ ‌ ‌ ‌ ‌ ‌ ‌ ‌ ‌ ‌ ‌ ‌ ‌   ‌ ‌ ‌ ‌ ‌ ‌ ‌ ‌ ‌ ‌ ‌ ‌ ‌   ‌ ‌ ‌ ‌ ‌ ‌ ‌ ‌ ‌ ‌ ‌ ‌ ‌   ‌ ‌ ‌ ‌ ‌ ‌ ‌ ‌ ‌ ‌ ‌ ‌ ‌   ‌ ‌ ‌ ‌ ‌ ‌ ‌ ‌ ‌ ‌ ‌ ‌ ‌   ‌ ‌ ‌ ‌ ‌ ‌ ‌ ‌ ‌ ‌ ‌ ‌ ‌   ‌ ‌ ‌ ‌ ‌ ‌ ‌ ‌ ‌ ‌ ‌ ‌ ‌   ‌ ‌ ‌ ‌ ‌ ‌ ‌ ‌ ‌ ‌ ‌ ‌ ‌   ‌ ‌ ‌ ‌ ‌ ‌ ‌ ‌ ‌ ‌ ‌ ‌ ‌   ‌ ‌ ‌ ‌ ‌ ‌ ‌ ‌ ‌ ‌ ‌ ‌ ‌   ‌ ‌ ‌ ‌ ‌ ‌ ‌ ‌ ‌ ‌ ‌ ‌ ‌ 
Chuck's Trade of the Day

October 14th, 2021

Nasdaq ETF Maintains Strong 'Buy' Signal

Dear Reader,

Yesterday, we looked at a Daily Price Chart for Salesforce.com, Inc. noting that the stock had retraced below the upper Keltner Channel in the ‘Buy Zone’.

For today’s Trade of the Day e-letter we will be looking at a daily price chart for ProShares Ultra QQQ ETF symbol: QLD.

Before breaking down QLD’s daily chart let’s first review the investment objective of the ETF.

The QLD ETF seeks daily investment results, before fees and expenses, that correspond to two times the daily performance of the NASDAQ-100 Index. The index includes 100 of the largest domestic and international non-financial companies listed on The Nasdaq Stock Market based on market capitalization.

Now, let’s begin to break down the Daily Price chart for the QLD ETF.

Below is a Daily Price chart with the 50-Day EMA and 100-Day EMA for QLD.

50-Day EMA and 100-Day EMA ‘Buy’ Signal

The 50-Day Exponential Moving Average (EMA) and 100-Day EMA are moving average indicator lines that can provide buy and sell signals when used together. When the shorter-term 50-Day EMA crosses above or below the longer-term 100-Day EMA, this provides either a buy or sell signal depending on which direction the ETF price is moving.

  • 50-Day EMA line Above 100-Day EMA = Price Uptrend = Buy signal
  • 50 Day EMA line Below 100-Day EMA = Price Downtrend = Sell signal

When the 50-Day EMA (blue line) crosses above the 100-Day EMA (red line) this indicates that the ETF’s buying pressure has begun to outweigh the selling pressure signaling a ‘buy’ signal. When the 50-Day EMA crosses below the 100-Day EMA this indicates that the selling pressure has begun to outweigh the buying pressure signaling a ‘sell’ signal.

Buy QLD ETF

As the chart shows, on June 11th, 2020, the QLD 50-Day EMA, crossed above the 100-Day EMA.

This crossover indicated the buying pressure for the QLD ETF exceeded the selling pressure. For this kind of crossover to occur, an ETF has to be in a strong bullish trend.

Now, as you can see, the 50-Day EMA is still above the 100-Day EMA meaning the ‘buy’ signal is still in play.

As long as the 50-Day EMA remains above the 100-Day EMA, the ETF is more likely to keep trading at new highs and should be purchased.

Our initial price target for QLD stock is 80.00 per share.


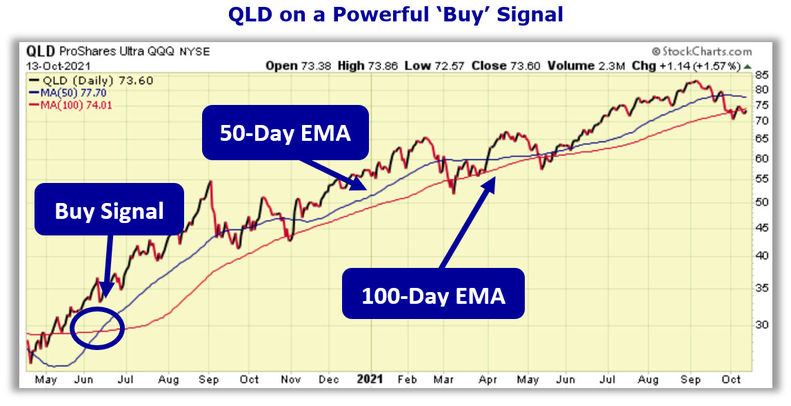
Profit if QLD Is Down 10%

Now, since QLD’s 50-Day EMA is trading above the 100-Day EMA and will likely rally from here, let’s use the Optioneering calculator to look at the potential returns for a QLD covered call trade. Covered calls are also known as buy writes.

The Buy Write Calculator will calculate the profit/loss potential for a covered call trade based on the price change of the underlying stock/ETF at option expiration in this example from a 10% increase to a 10% decrease in the QLD ETF at option expiration.

The goal of this example is to demonstrate the ‘built in’ profit potential for covered calls and the ability of covered calls to profit if the underlying ETF is up, down or flat at option expiration. Out of fairness to our paid option service subscribers we don’t list the option strike price used in the profit/loss calculation.

The prices and returns represented below were calculated based on the current ETF and option pricing for QLD on 10/13/2021 before commissions.

Built in Profit Potential

For this covered call, the calculator analysis below reveals the cost or the breakeven price is $5,454.00 (circled). The maximum risk for a covered call is the cost of the covered call.

The analysis reveals that if QLD is flat at 73.69 or up at all at expiration the covered call will realize a $1,846.00 profit and a 33.8% return (circled).

If QLD decreases 5.0% at option expiration, the covered call will realize a $1,546.55 profit and a 28.4% return.

And if QLD decreases 10.0% at option expiration, the covered call will realize a $1,178.10 profit and an 21.6% return.

Due to option pricing characteristics, this covered call has a ‘built in’ 33.8% profit potential when the trade was initiated.

Covered call trades can result in a higher percentage of winning trades compared to a directional stock trade if you can profit when the underlying stock/ETF is up, down or flat.

A higher percentage of winning trades can give you the discipline needed to become a successful trader.

The Optioneering Team is here to help you identify winning trades just like this one.

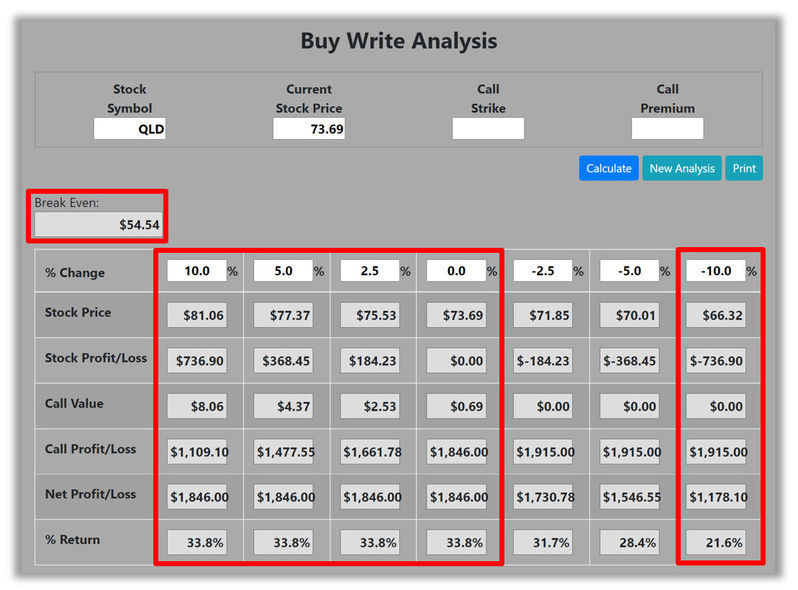
Interested in accessing the Optioneering Calculators? Join one of Chuck's Trading Services for unlimited access! The Optioneering Team has option calculators for six different option strategies that allow you to calculate the profit potential for an option trade before you take the trade.

Get Chuck's Trades Sent to You!

Do you want to start receiving hand-picked trades from 10-Time Trading Champion, Chuck Hughes?

As a Trade of the Day subscriber, Chuck is offering you a special discount on his Weekly Option Alert Trading Service.

Just call Brad at 1-866-661-5664 or 1-310-647-5664 to join and use the code "Optioneering VIP" to receive special pricing!


Wishing You the Best in Investing Success,

Chuck Huges Signature

Chuck Hughes

Editor, Trade of the Day

Have any questions? Email us at dailytrade@chuckstod.com


If you didn't create an account using this email address, please ignore this email or unsubscribe.

To ensure delivery of this email to your inbox and to enable images to load in future mailings, please add todaystrade@chuckstod.com to your e-mail address book or safe senders list.

© 2021 Tradewins Publishing. All rights reserved. The information provided by the newsletters, trading, training and educational products related to various markets (collectively referred to as the "Services") is not customized or personalized to any particular risk profile or tolerance. Nor is the information published by Legacy Publishing, LLC ("Legacy") a customized or personalized recommendation to buy, sell, hold, or invest in particular financial products. Past performance is not necessarily indicative of future results. Trading and investing involve substantial risk and is not appropriate for everyone. The actual profit results presented here may vary with the actual profit results presented in other Legacy Publishing LLC publications due to the different strategies and time frames presented in other publications. Trading on margin carries a high level of risk and may not be suitable for all investors. Other than the refund policy detailed elsewhere, Legacy does not make any guarantee or other promise as to any results that may be obtained from using the Services. Legacy disclaims any and all liability for any investment or trading loss sustained by a subscriber. You should trade or invest only 'risk capital' - money you can afford to lose. Trading stocks and stock options involves high risk and you can lose the entire principal amount invested or more. There is no guarantee that systems, indicators, or trading signals will result in profits or that they will not produce losses. Some profit examples are based on hypothetical or simulated trading. This means the trades are not actual trades and instead are hypothetical trades based on real market prices at the time the recommendation is disseminated. No actual money is invested, nor are any trades executed. Hypothetical or simulated performance is not necessarily indicative of future results. Hypothetical performance results have many inherent limitations, some of which are described below. Also, the hypothetical results do not include the costs of subscriptions, commissions, or other fees. Because the trades underlying these examples have not actually been executed, the results may understate or overstate the impact of certain market factors, such as lack of liquidity. Legacy makes no representations or warranties that any account will or is likely to achieve profits similar to those shown. No representation is being made that you will achieve profits or the same results as any person providing a testimonial. No representation is being made that any person providing a testimonial is likely to continue to experience profitable trading after the date on which the testimonial was provided, and in fact the person providing the testimonial may have subsequently experienced losses. The cost basis for some of the options in a portfolio may be reduced by rolling over profits at option expiration which is one of the Hughes Optioneering Trade Management Rules. Some income figures presented represent the total amount of option premium collected during the referenced period. Actual profits were less. Open trade profit results may have increased or decreased when the trades were closed out. Chuck Hughes' experiences are not typical. Chuck Hughes is an experienced investor and your results will vary depending on risk tolerance, amount of risk capital utilized, size of trading position, willingness to follow the rules and other factors.

You are currently subscribed to tod as: penunggangbadai.moneyblog@blogger.com.
Add todaystrade@chuckstod.com to your email address book to ensure delivery.
Forward to a Friend | Manage Subscription | Subscribe | Unsubscribe | Snooze
                                 

Subscribe to receive free email updates:

Related Posts :

0 Response to "Nasdaq ETF Maintains Strong 'Buy' Signal"

Post a Comment