| January 14th, 2022 Momentum Pushes Pharma Stock Upward Dear Reader, Yesterday, we looked at a Daily Price Chart of Charles Schwab Corp., noting the stock’s 24/52 Day MACD is trading above the 18-Day EMA signaling a ‘Buy’. For today’s Trade of the Day we will be looking at an On Balance Volume chart for GlaxoSmithKline plc. stock symbol: GSK. Before breaking down GSK’s OBV chart let’s first review which products and services are offered by the company. GlaxoSmithKline plc, together with its subsidiaries, engages in the creation, discovery, development, manufacture, and marketing of pharmaceutical products, vaccines, over-the-counter medicines, and health-related consumer products in the United Kingdom, the United States, and internationally. It operates through four segments: Pharmaceuticals, Pharmaceuticals R&D, Vaccines, and Consumer Healthcare. Confirming a Price Uptrend with OBV The GSK daily price chart below shows that GSK is in a price uptrend as the current price is above the price GSK traded at six months ago (circled). The On Balance Volume chart is below the daily chart. On Balance Volume measures volume flow with a single Easy-to-Read Line. Volume flow precedes price movement and helps sustain the price uptrend. When a stock closes up, volume is added to the line. When a stock closes down, volume is subtracted from the line. A cumulative total of these additions and subtractions form the OBV line. On Balance Volume Indicator ● When Close is Up, Volume is Added ● When Close is Down, Volume is Subtracted ● A Cumulative Total of Additions and Subtractions form the OBV Line Volume flow precedes price and is the key to measuring the validity and sustainability of a price trend. We can see from the OBV chart below that the On Balance Volume line for GSK is sloping up. An up-sloping line indicates that the volume is heavier on up days and buying pressure is exceeding selling pressure. Buying pressure must continue to exceed selling pressure in order to sustain a price uptrend. So, On Balance Volume is a simple indicator to use that confirms the price uptrend and its sustainability. The numerical value of the On Balance Volume line is not important. We simply want to see an up-sloping line to confirm a price up trend. 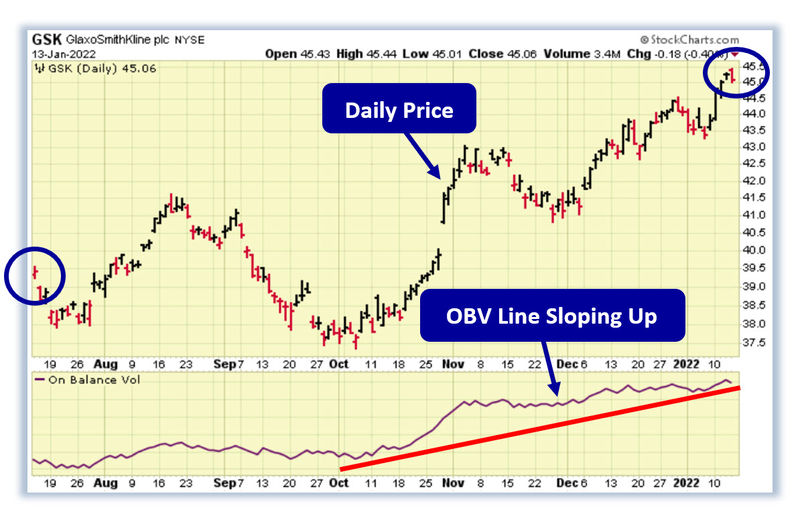
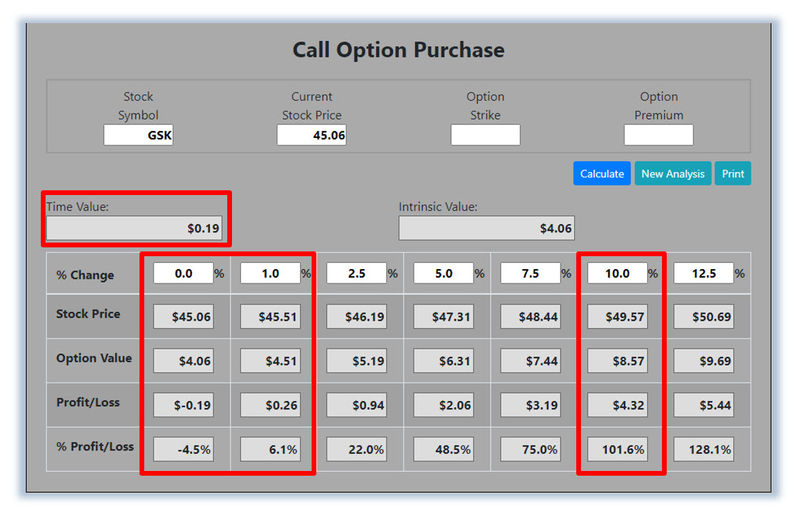
Confirmed ‘Buy’ Signal for GSK Since GSK's OBV line is sloping up, the most likely future price movement for GSK is up, making GSK a good candidate for a stock purchase or a call option purchase trade. Let's use the Hughes Optioneering calculator to look at the potential returns for a GSK call option. The Call Option Calculator will calculate the profit/loss potential for a call option trade based on the price change of the underlying stock/ETF at option expiration in this example from a flat GSK price to a 12.5% increase. The Optioneering Team uses the 1% Rule to select an option strike price with a higher percentage of winning trades. In the following GSK option example, we used the 1% Rule to select the GSK option strike price but out of fairness to our paid option service subscribers we don’t list the strike price used in the profit/loss calculation. | 


0 Response to "Momentum Pushes Pharma Stock Upward"
Post a Comment