Ticker Reports for September 30th

TJX Stock: A Buying Opportunity Before the Holiday Rush
The off-price trend has taken the retail wholesale sector by storm in the current economic climate. Consumers are trying to stretch their dollars but don't want to sacrifice quality. This rules out low-quality and low-price outlets like Dollar Tree Inc. (NASDAQ: DLTR) or even Dollar General Co. (NYSE: DG), which sells its items for more than $1, where you get what you pay for in terms of cost and quality. It’s the perfect storm environment for leading off-brand retailer The TJX Cos. (NYSE: TJX), who operates popular off-price stores like TJ Maxx, HomeGoods, and Marshalls.
The Rise of Off-Price Retailers and Gamification of Treasure Hunting
Off-price retailers are stores that sell brand-name merchandise at deeply discounted prices, often between 20% to 60% off regular retail prices. Since they buy opportunistically in bulk, their inventory is always changing based on availability rather than seasonality. This creates a ‘treasure hunting’ effect that gamifies shopping for bargain hunters, never knowing what great deals they may find on any given day. Off-price retailers fulfill the need to get the most bang for the buck without sacrificing quality.
Some of the most popular off-price retailers include Ross Stores Inc. (NASDAQ: ROST), Burlington Stores Inc. (NYSE: BURL), and Nordstrom Inc. (NYSE: JWN) Nordstrom Rack department stores, which now outnumber its full-price namesake locations.
TJX Companies Portfolio of Brands
TJX is the world's leading off-price apparel and home fashion retailer, with over 4,900 stores located throughout nine countries on three continents. While the most popular brands are TJ Maxx, Marshalls (Marmaxx), and HomeGoods in the United States, their other brands, Sierra, Winners, HomeSense, and TJ Maxx variations (TJX Canada and TJX International Europe and Australia), are popular in other countries. TJX is also investing $360 million for a 35% stake in Brands For Less, a major off-price retailer in Dubai, United Arab Emirates, and Saudi Arabia with over 100 stores.
Marmaxx, which combines TJ Max and Marshalls fashion apparel stores, saw 5% YoY comparable sales in the fiscal second quarter of 2025, on top of the 8% YoY comp sales from the year-ago period. HomeGoods comp sales rose 2% YoY on top of the 4% YoY comp sales last year. TJX Canada saw 2% YoY growth to $1.24 billion. TJX International, comprised of Australia and Europe, saw 4% YoY sales to $1.68 billion in the second quarter.
TJX Keeps the Momentum Flowing Into the Holiday Season
In its fiscal second-quarter 2025 earnings report, TJX beat consensus analyst estimates by 4 cents, reporting 92 cents. Revenues rose 5.6% YoY to $13.47 billion, beating $13.31 billion consensus estimates. Same-store sales (SSS) rose 4% YoY, nicely beating its guidance range of 2% to 3% YoY, completely driven by increased customer transactions. Pre-tax margin rose 50 bps to 10.9%, up from 10.4% last year. Total inventories were $6.5 billion, down from $6.4 billion in the year-ago period. TJX bought back $559 million in stock and ended the quarter with $5.3 billion in cash. The company opened its 5,000th store in the quarter.
TJX Issues Forecasts
For the third quarter of 2024, TJX sees EPS of $1.06 to $1.08, which is why of the $1.10 consensus estimates. Same-store comps are expected to be between 2% and 3%.
Full-year fiscal 2025 EPS is expected to be between $4.09 and $4.13 versus $4.03 and $4.13 consensus estimates. Full-year comps are expected to be 3% from 2% to 3%.
TJX CEO Ernie Herrman commented, “The third quarter is off to a strong start, and we have numerous plans underway to drive traffic and sales. Availability of quality branded merchandise is excellent, and we are confident we will have an exciting assortment of fresh goods across all of our stores and online throughout the fall and holiday selling seasons.”
TJX Stock Is in a Symmetrical Triangle Pattern
A symmetrical triangle pattern precedes a breakout or breakdown. It’s comprised of a converging descending upper trendline and ascending lower trendline connected at the apex point. The breakout or breakdown occurs ahead of reaching the apex point.
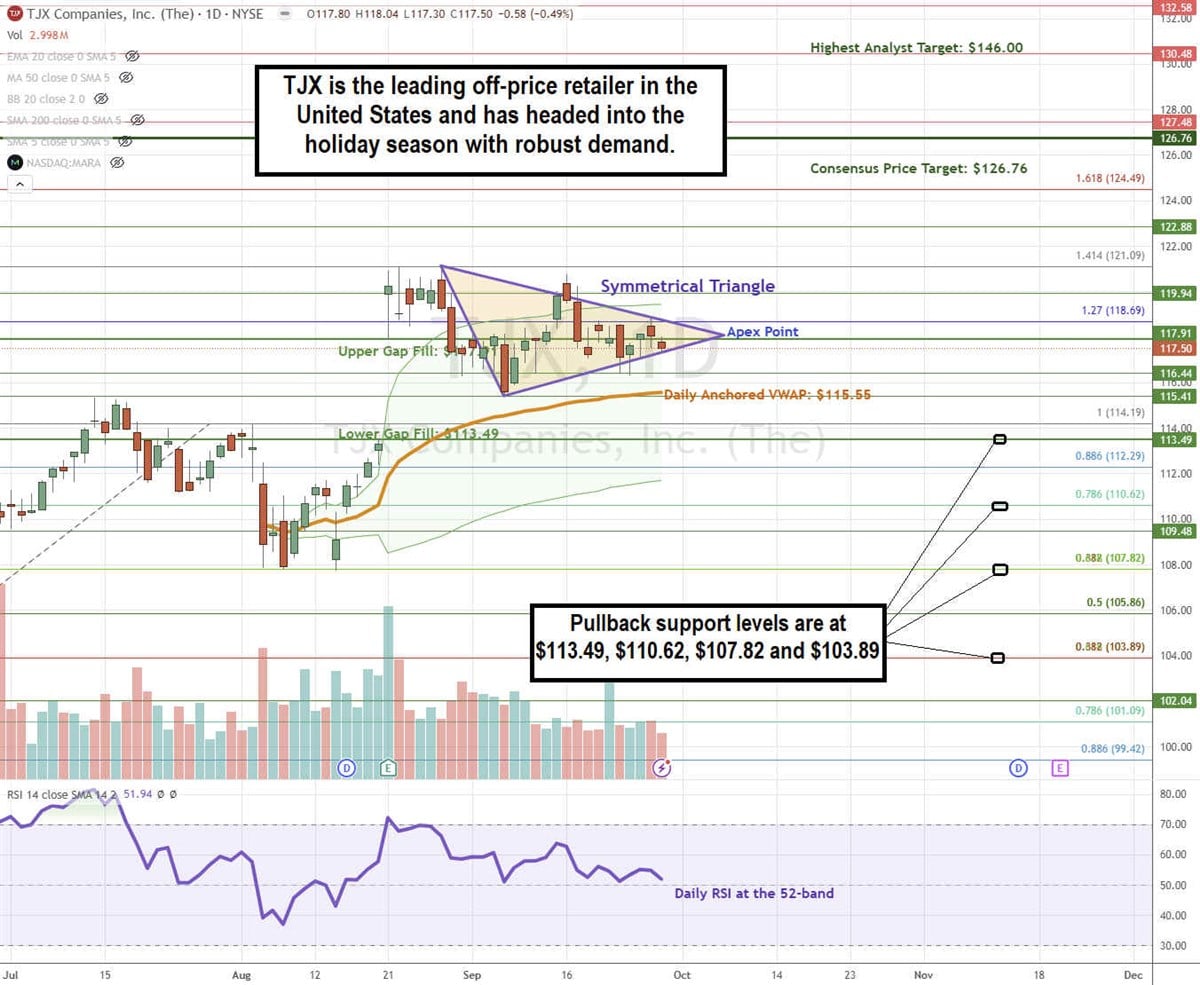
TJX gapped to $117.91 following its fiscal Q2 2025 earnings release. After peaking at $121.09, TJX formed a series of lower highs and higher lows, making up the two divergence trendlines meeting at the apex point near the upper gap-fill level of $117.91. The daily anchored VWAP is at $115.55. The daily relative strength index (RSI) has been trending lower to the 52-band. Fibonacci (Fib) pullback support levels are at $113.49, $110.62, $107.82, and $103.89.
TJX’s average consensus price target is $126.76, and its highest analyst price target is $148. Analysts have given it 13 Buy ratings and 3 Hold ratings.
Actionable Options Strategies: Bullish investors can buy on pullbacks using cash-secured puts to take advantage of the elevated premiums at the fib pullback support levels to buy the dip and write covered calls to execute a wheel strategy for income in addition to the 1.28% annual dividend yield.

Forget ChatGPT: Follow the AI Retirement Playbook
Everyone's talking about AI right now, but I've been talking about it for years.
Follow this two-part playbook… and it could help you make all the money you need.
Micron's Blowout Results Pave the Way for Seagate's Stock Surge
Seagate Technology Holdings plc (NASDAQ: STX) is a leading provider of consumer and enterprise data storage solutions. It is the largest hard disk drive (HDD) manufacturer in the world and also sells solid-state drives (SSD). Combined with rival Western Digital Co. (NASDAQ: WDC), the duopoly commands 80% of the global market share of HDD production.
The robust fiscal fourth-quarter 2024 results for memory chip maker Micron Technology Inc. (NASDAQ: MU) lifted the computer and technology sector, notably data storage products makers. The standout statistics were the 93% YoY revenue growth driven by the artificial intelligence (AI) and data center boom.
Data Storage Demand Will Only Grow
Data is everywhere and needs to be stored. That fact will never go away. Whether it's recording closed-circuit TV camera footage to storing files, videos or images, data is a secular trend. The advent of AI has upped the ante as it requires mountains and oceans of data for training and inferencing of AI models. That surging demand for data storage is a boon to Seagate. The AI and data center boom falls right into Seagate’s wheelhouse.
A zetabyte (ZB) is the equivalent of 1 trillion gigabytes (GB) and 1,000 petabytes (PB). An exabyte (EB) is 1,000 PBs. A PB is 1,000 terabytes (TB). A terabyte is 1,000 GB. One ZB can store 12.3 million 4K videos. In 2020, internet users generated 64.2 ZB of data. Annual data creation is expected to reach 147 ZB by the end of 2024.
With around 5.35 billion worldwide internet users, each user creates 15.87 terabytes of data daily. Alphabet Inc.'s Google manages nearly 20 PBs daily. YouTube uses 440,000 TBs daily. As data generation grows, Seagate will continue to accommodate the growth with its storage products.
Seagate Continues to Develop Game-Changing Technology
For its part, Seagate has been on the cutting edge of HDD technology. Its heat-assisted magnetic recording (HAMR) technology has been a game changer, enabling significant increases in HDD capacity and making it even cheaper to store massive amounts of data. Its MACH.2 multi-actuator technology uses two independent actuators within a single HDD, thereby improving the read/write speed and performance by doubling the data transfer rate. This ups the speed aspect of HDDs, which are considered much slower than SSDs.
HDDs Still Benefits From the AI Boom
While SSD is the preferred storage for AI applications due to its speed and reliability with no moving parts, the economics can be a burden. HDDs provide the most bang for the buck, enabling the cheap storage of much more data. As it turns out, developers may prefer to use fast SSD for AI training, inferencing, and applications. Still, since not all data is used constantly, there is also a growing need to store the rest of the data that are not accessed immediately economically. This is where HDDs come to the rescue.
Seagate Experiences Sequential Growth Surge
Seagate reported fiscal Q4 2024 EPS of $1.05, beating consensus estimates by 29 cents. Revenues rose 18% YoY to $1.89 billion, beating $1.87 billion consensus estimates, driven by strengthening global cloud computing demand. Non-GAAP gross margin rose 480 bps sequentially to 30.9%. Non-GAAP operating income rose 79% sequentially to $327 million. Adjusted EBITDA improved 45% sequentially to $404 million. Seagate shipped 114 exabytes (EB) of capacity in the quarter, up 15% sequentially QoQ. Nearline cloud revenue has more than doubled YoY, which is driven by traditional cloud computing workloads and new AI deployments.
Seagate Issues Downside Guidance
On Sept. 4, 2024, Seagate revealed it expects fiscal Q1 2025 EPS at the high end of its EPS guidance of $1.05 to $1.40, but still shy of $1.43 consensus estimates. Seagate CFO Gianluca Romano commented, “We guided the quarter sequentially no way higher from $1.05 to $1.40 as a midpoint. I think we can be in the high part of the range, so better than the midpoint that we guided. This is coming mainly from the mix moving more into the 48-terabyte CMR 28-terabyte SMR, and pricing is also a little bit better than what we were expecting.”
STX Forms an Ascending Triangle Breakout
An ascending triangle pattern is comprised of a flat-top upper trendline resistance converging at the apex point with ascending lower trendlines. The breakout occurs when the stock rises through the upper trendline resistance.
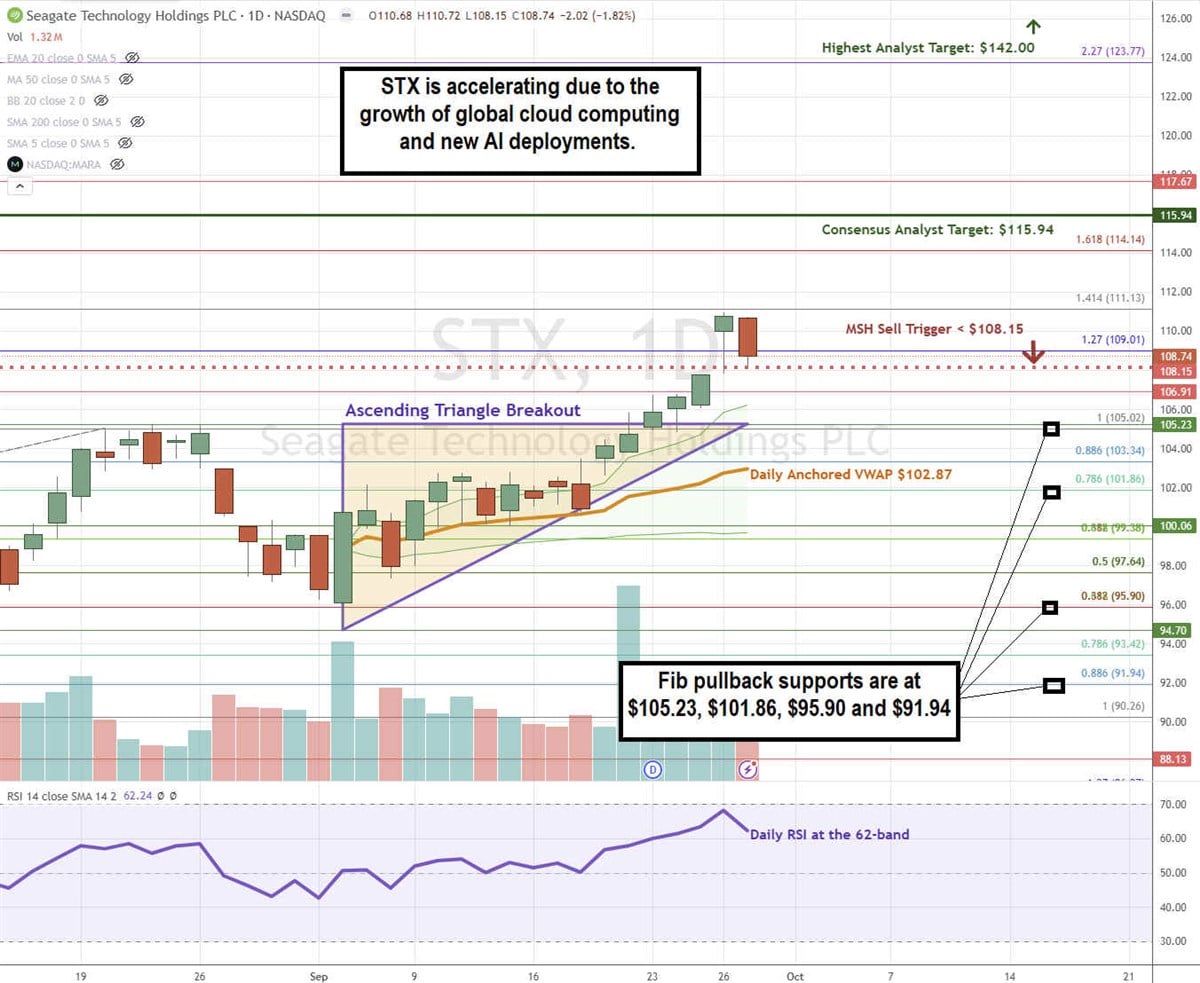
STX triggered the ascending triangle breakout on Sept. 23, 2024, surging through the $105.23 flat-top upper trendline resistance. STX continued to peak near $111.13 and formed a market structure high (MSH) sell trigger below $108.15. The daily anchored VWAP support rose to $102.87. The daily RSI peaked off the 70-band to slip to the 62-band. Fibonacci (Fib) pullback support levels are at $105.23, $101.86, $95.90, and $91.94.
Seagate Technologies’ average consensus price target is $115.94, and its highest analyst price target is $142.00. Analysts have given it 11 Buy ratings, seven Hold ratings, and two Sell ratings.
Actionable Options Strategies: Bullish investors can buy STX on pullbacks using cash-secured puts at the fib pullback support levels to buy the dip and write covered calls to execute a wheel strategy for income in addition to the 2.57% annual dividend yield.

Elites' Next Move: Trump & Your Savings in Danger!
Don't let the corrupt elites dictate your future—ACT NOW! This guide is your first step towards financial independence and security.
>> Get Your FREE Wealth Protection Guide <<
Zeta Global's AI Cloud: Your Secret Weapon for Massive Growth
Zeta Global Holdings Co. (NYSE: ZETA) is a data-driven marketing technology company that provides an artificial intelligence (AI) powered customer intelligence and marketing automation platform. The stock has taken a meteoric rise, up 234% year-to-date (YTD). This relatively obscure computer and technology sector company boasts many A-list clients serving 40% of the Fortune 100 companies, including American Express Co. (NYSE: AXP), Marriott International Inc. (NASDAQ: MAR), United Airlines Holdings Inc. (NASDAQ: UAL), T-Mobile US Inc. (NASDAQ: TMUS), AT&T Inc. (NYSE: T) and Verizon Communications Inc. (NYSE: VZ). The big question is how a little-known company is bagging major clients and why these major brands are attracted to Zeta and its AI-powered, all-on-one unified marketing platform.
Zeta’s Competitive Advantage is Data, Data, and More Data
“AI-powered” is a term that gets tossed around a lot, especially with marketing companies. However, the Zeta Customer Data Platform (CDP), a core component of the Zeta Marketing Platform, is unique in the massive oceans of data it collects around the clock. Its platform processes data from 12.7 billion global identifiers, over 1 trillion content consumption signals monthly, over 950 interest and intent audiences, and more than 250 million people in the United States.
Ingesting, analyzing, and distilling its massive datasets leveraging AI is done to turn strangers into customers and predict customers’ intent. It provides smarter analysis and intelligence, providing real-time reports and insights. The Zeta Marketing Platform is an all-in-one platform to manage and automate marketing campaigns. Zeta’s clients are major marketers and agencies that have major brand customers.
Zeta CDP ingests data by collecting it from numerous sources, including marketing automation platforms, social media, website analytics, offline channels, and CRM systems. Zeta CDP ingests and unifies the data to construct a single customer profile providing a holistic view of each customer with no silos.
Zeta Media Engine provides Zeta’s Intelligence, audience modeling, media activation, and ID resolution to marketers and agencies using Snowflake Inc. (NYSE: SNOW).
Zeta Leverages AI in a Useful and Quantifiable Way
The Zeta Messaging component of the Zeta Marketing Platform leverages AI to make email segmentation and targeting seamless and personalized. Customers can automate campaigns based on factors like transactions, events, and audiences using the knowledge of past purchases, real-time interest, channel preferences, and predictive intent. It's been able to increase the average order value by 9% with 51% less email volume and a 587% increase in revenues. Zeta was recognized as a leader in the Forrester Wave Email Marketing Services Providers of 2024, receiving the highest possible score of 13 out of 22 criteria, including process and workflow automation, personalization, AI and vision.
Zeta Growth Accelerating Also with Clients
Zeta reported its second quarter of 2024 EPS loss of 16 cents, matching consensus estimates. Revenues climbed 32.6% YoY to a record $227.8 million, beating $212.44 million consensus analyst estimates. Zeta grew quarterly scaled customer average revenue per user (ARPU) 22% YoY to $479,000, twice as fast as Q1 2024.
Zeta’s AI-powered personas and chatbots and over 400 AI-powered "Intelligent Agents" helped drive strong customer retention, enabling clients to show 3X revenue improvement over initial deployment levels.
Zeta Issues Upside Q3 and Full Year 2024 Guidance
Zeta Global provides upside Q3 2024 revenue guidance of $237.2 million to $241.2 million versus $230.52 million consensus estimates. The company increased adjusted EBITDA guidance from $46.8 million to $47.3 million, up from the previous guidance of $45.3 million. Full-year 2024 revenues are expected to be between $920 million and $930 million, crushing analyst consensus estimates of $900.49 million. Adjusted EBITDA was raised by $4.5 million to $174.5 million to $176.5 million from previous guidance of $171 million. Free cash flow is expected to be between $80 million and $90 million.
Zeta Global CEO David Steinburg commented, “Artificial Intelligence is disrupting legacy marketing clouds, which, in some cases, are even shutting down parts of their business, creating a large opportunity for more innovative, agile, and AI-powered marketing technology companies like Zeta.
Steinburg emphasized, “As I have stated before, AI has moved from science fiction to a boardroom conversation. Boards are asking CEOs what is their AI strategy. In turn, CEOs are asking their CTOs, CMOs, and CIOs for their plans. And they are turning to us because we turn AI into real-world results for marketers.”
ZETA Stock Forms a Parabolic Arc
A parabolic arc is a topping pattern comprised of a swing high followed by a rounding bottom that rips back up through the swing high in a steep, surging manner. As the stock makes a blow-off top, it forms a market structure high (MSH) trigger following its highest high candle.
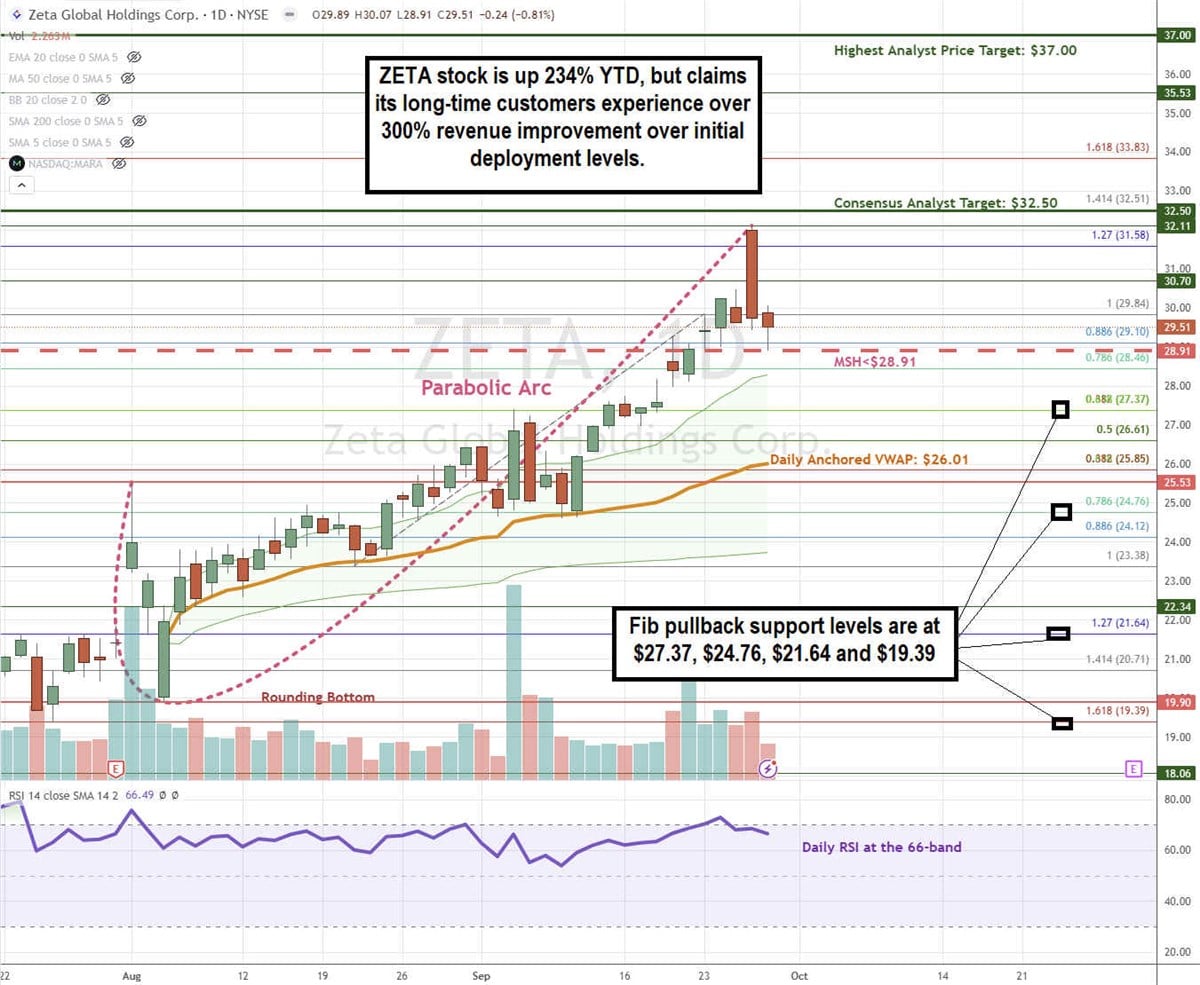
ZETA formed its initial swing high at $25.53 below, falling back down to $19.90, forming a rounding bottom that rose back up through its $35.53 swing high and proceeded to accelerate to $32.11. The daily market structure high (MSH) sell triggers under $28.91. The daily anchored VWAP support is at $26.01. The daily relative strength index (RSI) peaked and fell below the 70-band. Fibonacci (Fib) pullback support levels are at $27.37, $24.76, $31.64 and $19.39.
Zeta Global’s average consensus analyst price target is $32.50, and its highest analyst price target sits at $37.00. Analysts have given it 13 Buy ratings and one Hold rating.
Actionable Options Strategies: ZETA stock is up 234% in 2024, and a daily MSH sell triggers under $28.91. Bullish investors should be patient and may consider buying on pullbacks using cash-secured puts at the lower Fib pullback support levels to buy the dip and write covered calls to execute a wheel strategy for income.
MarketBeat Media, LLC dba TickerReport
345 N Reid Place, Suite 620, Sioux Falls, SD 57103.
0 Response to "🌟 Micron’s Blowout Results Pave the Way for Seagate’s Stock Surge"
Post a Comment