Ticker Reports for November 20th
Target Results Are Not a Retail Bellwether: Why the Dip Is a Buy
While Target (NYSE: TGT) has been a bellwether of retail sector health in recent years, it is not today. The company’s lackluster results are due to its operational quality and lack of relevance in an environment where consumers are budget-conscious. Results from other retailers, including Walmart (NYSE: WMT), The TJX Companies (NYSE: TJX), and Williams-Sonoma (NYSE: WSM), show them growing, sustaining margin strength or widening margin and providing a healthy outlook for these trends to continue. The take on consumer health ex-Target is that strong labor trends point to a healthy spending season, with growth likely above the consensus estimates.
Target Results Aren’t All Bad: Shares Move to Rock Bottom Price Point
Target’s results are weak compared to the analysts' forecasts and the industry average, but not all bad for investors. The company sustained growth with revenue of $25.67 billion, up 1.15 year-over-year. The gain was made on a 0.3% comp driven by a 2.4% increase in traffic and a 10.8% increase in digital sales. Regarding brick-and-mortar traffic, beauty, food and beverage, and dailies remain areas of strength.
The margin news is also mixed with compression, compounding the top-line weakness. The gross margin contracted by 20 bps and the operating margin by 60 due to higher inventory costs, supply chain costs, and digital fulfillment. The net result is an adjusted EPS of $1.85, 2000 basis points shy of the consensus but still sufficient to sustain the company’s financial health and capital returns.
The guidance is equally bad, with comps expected to be flat compared to last year and positive forecasts from its competitors. However, the guidance also calls for EPS sufficient to sustain the capital return program if it dampens the outlook for the pace of buybacks. The full-year adjusted EPS target of $8.90 is $.60 shy of the consensus reported by MarketBeat.com but provides a sustainable dividend payout ratio of 52%.
Target’s Balance Sheet and Cash Flow Can Sustain Capital Returns
Capital return in Q3 included $516 million in dividends and another $354 in buybacks. The dividend is worth more than 3.5% in annualized return, with shares trading near long-term lows. The buybacks reduced the share count, down 0.2% for the quarter, and are expected to continue, if at a reduced pace, until earnings quality improves.
The cash flow and balance sheet highlights are good. The company’s cash flow was negative for the quarter but offset by YTD strength; cash is up, inventory is up, current and total assets are up, and liabilities are flat. Long-term debt leverage remains low at only 1x equity, and equity is rising, up by 15% compared to last year.
Analyst Sentiment Weighs on Target Stock Price
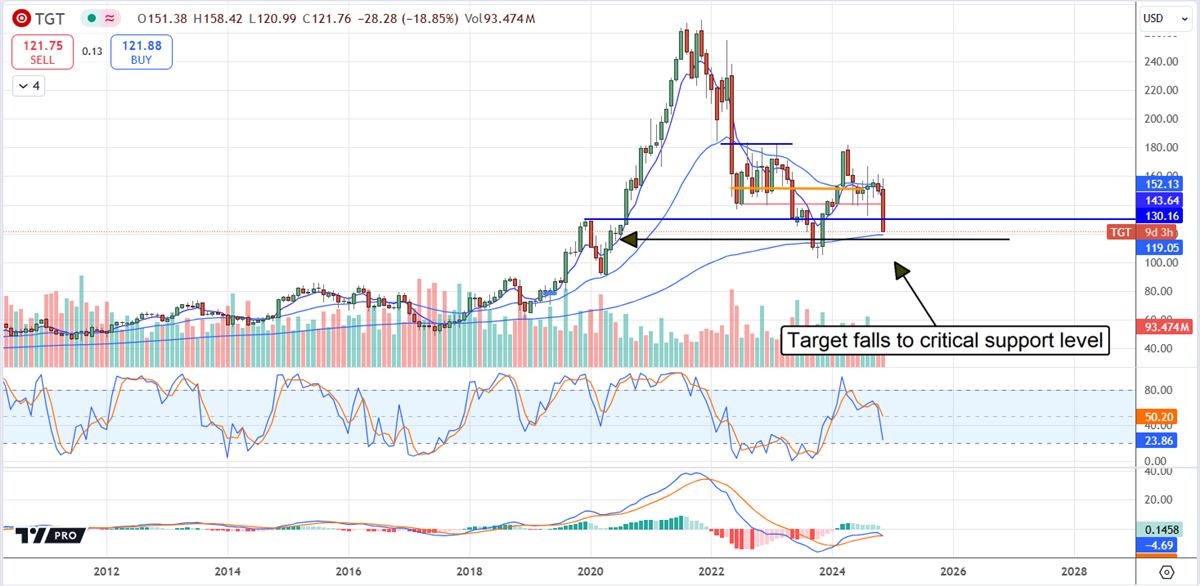
The initial response from analysts isn’t good, including two downgrades and price target reductions, but it could be worse. The new ratings are Hold, down from Buys, with targets of $108 and $130. The mid-point of that range aligns with the recent stock price lows and may provide a floor for the market. If not, this stock could set new lows and move significantly lower from there. In that scenario, Target's shares could enter a sustained downtrend from which it may never recover.
The likely scenario is that support will hold at the bottom of the trading range, which aligns with a long-term moving average that has provided support before. In this scenario, Target's stock price may wallow near current levels until more news is available. Because economic headwinds are expected to ease in 2025 and tailwinds to develop, Target’s business and stock price could begin to improve by the middle of next year.

50-year Wall Street legend: "Sell this tech stock NOW"
Something very strange is happening to U.S. stocks following President Trump's victory...
And this could spell disaster for some of America's favorite tech companies.

Williams-Sonoma Stock: Buy It and Never Let It Go
Williams-Sonoma (NYSE: WSM) offers everything an investor could want and more, making it a stock worthy of buy-and-hold status. Its quality is centered on the brand and operations, which CEO Laura Alber stewards. The results of her tenure include growth, operational improvement, market share gain, increased brand loyalty, and robust cash flow, allowing for sustained re-investment in the business while maintaining a fortress balance sheet and a healthy capital return.
Regarding capital returns, the payment from Williams-Sonoma is about as good as it gets, including an attractive dividend and count-reducing share buybacks.
Among the FQ3 earnings report highlights is a $5 billion increase in the existing authorization, worth about 30% of the pre-release market cap and instrumental in the market's response. The market surged more than 20% to near-record highs and will likely trend higher over the next year. Other highlights include noteworthy mentions of revenue and earnings trends and increased guidance, likely to be cautious given the trends.
Williams-Sonoma Has Beat-and-Raise Quarter, Widens Margin
Williams-Sonoma had a solid quarter, revealing the resilience of its consumer base and the impact of Ms. Alber’s work over the past few years. The company’s revenue is contracting on lower comps due to headwinds and the post-COVID letdown. Still, the $1.8 billion is down only 2.7% and outpaced the consensus estimate reported by MarketBeat. Segmentally, most segments' revenue was down, with Pottery Barn leading at 7.5%. West Elm fell 3.5%, and the core Williams-Sonoma brand only 0.1%. Pottery Barn Kids, a source of persistent strength, grew by 3.8%.
Margin news is even better. The company widened its gross margin on price realization, lower cost of goods, and operational improvements. The merchandise margin improved by 130 bps, and the supply chain improved by 100, driving a 230-based increase in the gross margin. Increased SG&A offset the gain to a degree, but not completely. The operating margin widened by 80 basis points to 17.8%, above the high end of the long-term target range. The critical detail is that the adjusted EPS of $1.96 outpaced the consensus by $0.19 or nearly 1100 basis points and grew 7.1% compared to the top-line contraction.
The guidance is icing on the investment cake. The company raised its revenue and margin guidance for the year because of revenue and margin trends. The company expects revenue to contract only 3% to 1.5%, raising the low end of the range by 100 bps and for a margin of 17.8% to 18.2%, up 40 basis points from the previous guide.
Williams-Sonoma Has Cash Flow and a Balance Sheet to Be Envious Of
Williams-Sonoma has cash flow and a balance sheet any company would envy. The quarterly and YTD cash flow allowed the company to increase its cash position compared to last year while returning more than $600 million to investors. The capital return includes $73 million in dividends and $533 million in buybacks, reducing the count by 2% for the quarter.
The pace of buybacks is expected to continue robustly as the year progresses, and in 2025, nothing on the balance sheet suggests otherwise. Details show cash, inventory, current, and total assets rising, liability and debt relatively flat, leverage low with total liability about 1.6x equity and equity rising. Shareholder equity increased by 5%.
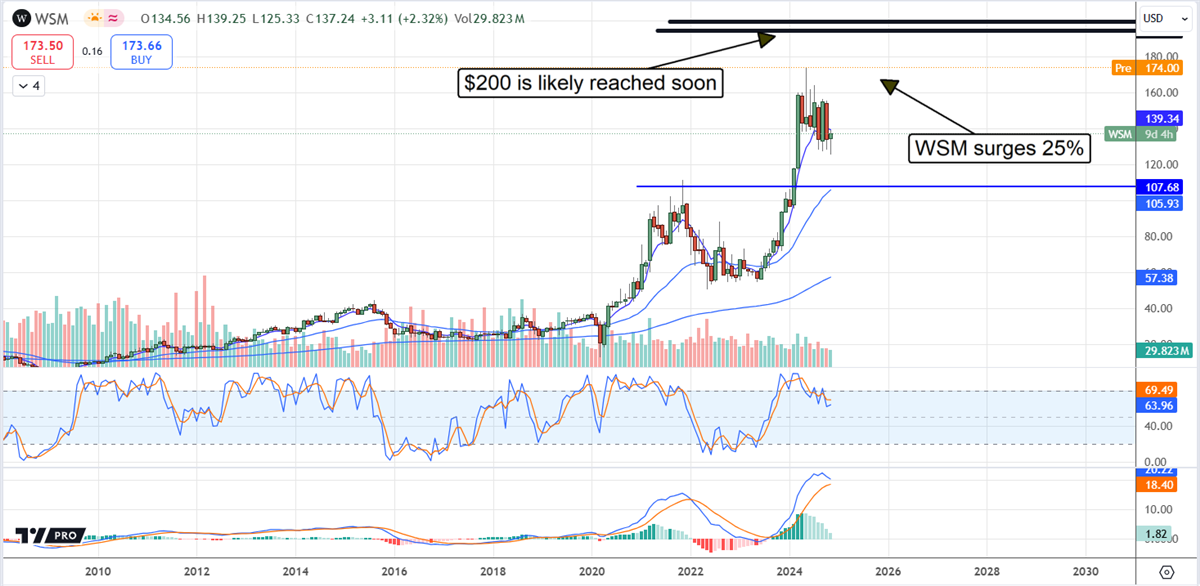
The price action in WSM stock is robust in the premarket session following the earnings release. The market is up more than 20%, showing robust support at the bottom of a trading range and the potential to set new highs.
The critical resistance is near $175 and will likely be broken soon. A move above $175 would signal a continuation of the trend begun in 2023 and likely take the market up to the $200 level, as indicated by the technical projections.

Has Trump Finally Gone Too Far?
Lately, there's been a lot of buzz around a secret loophole executive insiders are using to make millions buying and selling their own stocks.
It's so powerful ... so profitable ... that most people immediately assume this is just another example of Trump doing what's best for business executives.
But surprisingly, this loophole has been on the books for many years and executives have been using it to make HUNDREDS of millions of dollars.
And here's the good news.

5 Dividend ETFs to Buy and Hold Forever
For conservative investors seeking steady income and long-term growth, dividend ETFs offer a reliable "buy and hold" strategy. These funds provide diversification, consistent payouts, and the ease of passive management, making them ideal for a stable, hands-off portfolio. With careful selection, dividend ETFs can be a cornerstone of a traditional investment plan, delivering income and growth for years to come.
So, let’s explore five top dividend ETFs for the traditional long-term investor who wants to compound their investment over time.
Vanguard S&P 500 ETF Nears 52-Week High with Over 300% Returns Since 2011
Vanguard S&P 500 ETF (NYSE: VOO) is a flagship ETF that tracks the S&P 500 Index, offering exposure to 500 of the largest U.S. companies.
With a low expense ratio of 0.03% and a dividend yield of 1.1%, VOO provides a cost-effective way to invest in the U.S. stock market's overall performance.
Year-to-date, VOO is up over 24%, trading near its 52-week high, and has delivered over 300% returns since its 2011 launch, excluding dividends.
With $568 billion in assets under management and a 96.4% U.S. market exposure, VOO is a staple for stability and long-term growth.
Utilities Select Sector SPDR Fund: Defensive and Steady Income
Utilities Select Sector SPDR Fund (NYSE: XLU) focuses on the utilities sector, which is known for its defensive characteristics and steady income.
This ETF holds electric, multi-utilities, and gas utility companies, providing a current dividend yield of 2.56%.
Year-to-date, XLU has gained over 27%, driven partly by increased energy demand from AI and data centers, which has sparked renewed interest in power generation and nuclear energy.
With a low expense ratio of 0.09%, solid dividend yield, and upward momentum, XLU remains a solid pick for conservative investors seeking stable income and growth in a thriving sector.
SPDR S&P Dividend ETF: Focused on Dividend Growth Leaders
The SPDR S&P Dividend ETF (NYSE: SDY) is designed for income-focused investors by tracking companies with a history of increasing dividends for at least 20 consecutive years.
Its diverse portfolio of 133 holdings includes top-holding blue-chip names like Chevron, Realty Income, and Kenvue.
The ETF boasts a 2.29% dividend yield and has gained nearly 12% year-to-date.
With 95.5% U.S. exposure and a balanced sector allocation across industries such as industrials, utilities, and financials, SDY offers a combination of stability and consistent income growth.
JPMorgan Equity Premium Income ETF Offers Steady Income with Lower Market Volatility
JPMorgan Equity Premium Income ETF (NYSE: JEPI) stands out for its high yield, currently at 10.7%, making it a favorite among income investors.
The fund employs a covered call strategy, selling options on low-volatility, value-oriented large-cap stocks to generate premium income while reducing overall portfolio risk.
JEPI has delivered an 8% return year-to-date, which climbs into the high teens when factoring in its monthly dividends.
With an expense ratio of 0.35%, JEPI appeals to investors seeking a steady income stream with less exposure to market volatility.
Schwab U.S. Dividend Equity ETF Combines Income and Growth for Long-Term Investors
Schwab U.S. Dividend Equity ETF (NYSE: SCHD) is a leader in dividend growth investing, delivering impressive returns by tracking the Dow Jones U.S. Dividend 100 Index.
This ETF focuses on companies with at least ten consecutive years of uninterrupted dividend payments and strong financial fundamentals.
Since its inception in 2011, SCHD has delivered an average annual return of 13.4%, outperforming the S&P 500's 11% over the same period.
With its disciplined investment strategy, SCHD combines income and capital appreciation, making it a top choice for conservative, long-term investors.
The Bottom Line
Dividend ETFs like VOO, XLU, SDY, JEPI, and SCHD offer stability, consistent income, and long-term growth potential, making them ideal for conservative investors. Whether prioritizing market-wide exposure, sector-specific plays, or high-yield strategies, these ETFs provide an excellent foundation for a buy-and-hold portfolio that can stand the test of time.
MarketBeat Media, LLC dba TickerReport
345 N Reid Place, Suite 620, Sioux Falls, SD 57103.
0 Response to "🌟 Target Results Are Not a Retail Bellwether: Why the Dip Is a Buy"
Post a Comment