| September 21st, 2021 Medical Instruments Co. Trending Up Dear Reader, Yesterday, we looked at a Monthly Price Chart of Lululemon Athletica Inc., noting the stock’s 1-Month Price is trading above the 10-Month SMA signaling a ‘Buy’. For today’s Trade of the Day we will be looking at an On Balance Volume chart for Repligen Corp. stock symbol: RGEN. Before breaking down RGEN’s OBV chart let’s first review which products and services are offered by the company. Repligen Corporation develops and commercializes bioprocessing technologies and systems for use in biological drug manufacturing process in North America, Europe, the Asia Pacific, and internationally. It offers Protein A ligands that are the binding components of Protein A affinity chromatography resins; and cell culture growth factor products. Confirming a Price Uptrend with OBV The RGEN daily price chart below shows that RGEN is in a price uptrend as the current price is above the price RGEN traded at five months ago (circled). The On Balance Volume chart is below the daily chart. On Balance Volume measures volume flow with a single Easy-to-Read Line. Volume flow precedes price movement and helps sustain the price uptrend. When a stock closes up, volume is added to the line. When a stock closes down, volume is subtracted from the line. A cumulative total of these additions and subtractions form the OBV line. On Balance Volume Indicator ● When Close is Up, Volume is Added ● When Close is Down, Volume is Subtracted ● A Cumulative Total of Additions and Subtractions form the OBV Line Volume flow precedes price and is the key to measuring the validity and sustainability of a price trend. We can see from the OBV chart below that the On Balance Volume line for RGEN is sloping up. An up-sloping line indicates that the volume is heavier on up days and buying pressure is exceeding selling pressure. Buying pressure must continue to exceed selling pressure in order to sustain a price uptrend. So, On Balance Volume is a simple indicator to use that confirms the price uptrend and its sustainability. The numerical value of the On Balance Volume line is not important. We simply want to see an up-sloping line to confirm a price up trend. 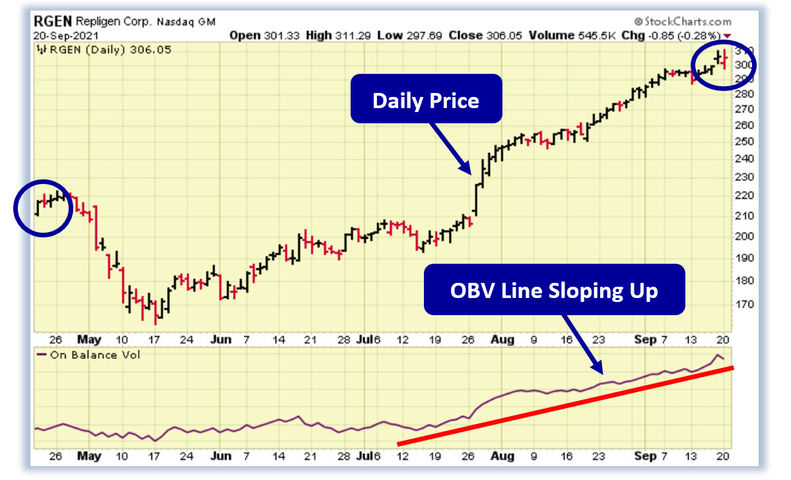
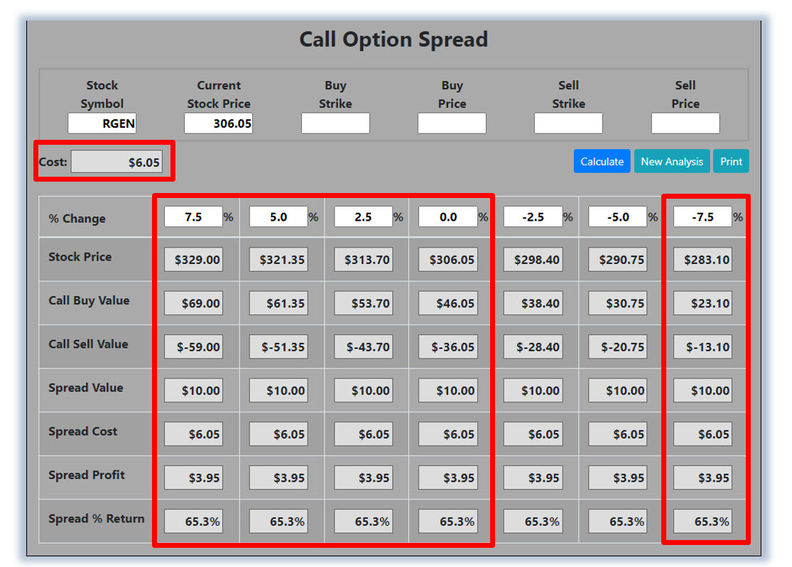
Confirmed ‘Buy’ Signal for RGEN Since RGEN's OBV line is sloping up, the most likely future price movement for RGEN is up, making RGEN a good candidate for a stock purchase or a debit spread trade. Let's use the Hughes Optioneering calculator to look at the potential returns for a RGEN debit spread. The Call Option Spread Calculator will calculate the profit/loss potential for a call option spread based on the price change of the underlying stock/ETF at option expiration in this example from a 7.5% increase to a 7.5% decrease in RGEN stock at option expiration. The goal of this example is to demonstrate the ‘built in’ profit potential for option spreads and the ability of spreads to profit if the underlying stock is up, down or flat at option expiration. Out of fairness to our paid option service subscribers we don’t list the option strike prices used in the profit/loss calculation. The prices and returns represented below were calculated based on the current stock and option pricing for RGEN on 9/20/2021 before commissions. | 


0 Response to "Medical Instruments Co. Trending Up"
Post a Comment