| March 18th, 2022 Buying Pressure Sends CNC Higher Dear Reader, Yesterday, we looked at a Daily Price Chart of FMC Corp., noting the stock has been making a series of higher highs and higher lows since mid-November. For today’s Trade of the Day we will be looking at an On Balance Volume chart for Centene Corp. stock symbol: CNC. Before breaking down CNC’s OBV chart let’s first review which products and services are offered by the company. Centene Corporation operates as a multi-national healthcare enterprise that provides programs and services to under-insured and uninsured individuals in the United States. Its Managed Care segment offers health plan coverage to individuals through government subsidized programs, including Medicaid, the State children's health insurance program, long-term services and support, foster care, and medicare-medicaid plans, which cover dually eligible individuals, as well as aged, blind, or disabled programs. Confirming a Price Uptrend with OBV The CNC daily price chart below shows that CNC is in a price uptrend as the current price is above the price CNC traded at six months ago (circled). The On Balance Volume chart is below the daily chart. On Balance Volume measures volume flow with a single Easy-to-Read Line. Volume flow precedes price movement and helps sustain the price uptrend. When a stock closes up, volume is added to the line. When a stock closes down, volume is subtracted from the line. A cumulative total of these additions and subtractions form the OBV line. On Balance Volume Indicator ● When Close is Up, Volume is Added ● When Close is Down, Volume is Subtracted ● A Cumulative Total of Additions and Subtractions form the OBV Line Volume flow precedes price and is the key to measuring the validity and sustainability of a price trend. We can see from the OBV chart below that the On Balance Volume line for CNC is sloping up. An up-sloping line indicates that the volume is heavier on up days and buying pressure is exceeding selling pressure. Buying pressure must continue to exceed selling pressure in order to sustain a price uptrend. So, On Balance Volume is a simple indicator to use that confirms the price uptrend and its sustainability. The numerical value of the On Balance Volume line is not important. We simply want to see an up-sloping line to confirm a price up trend. 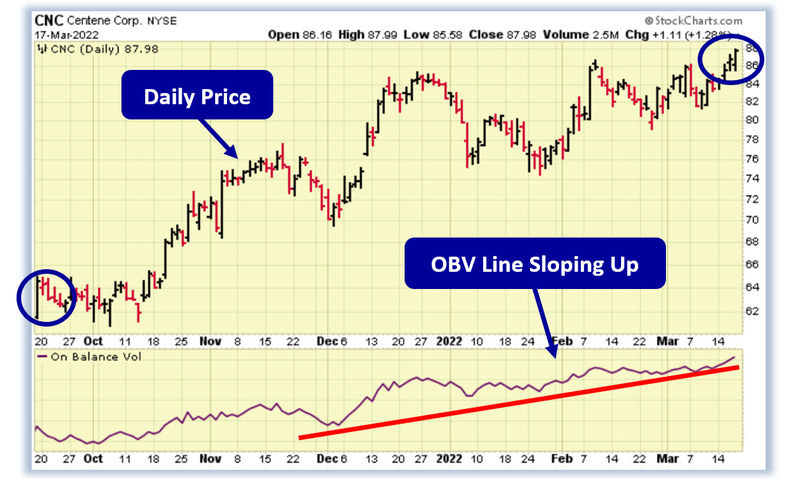
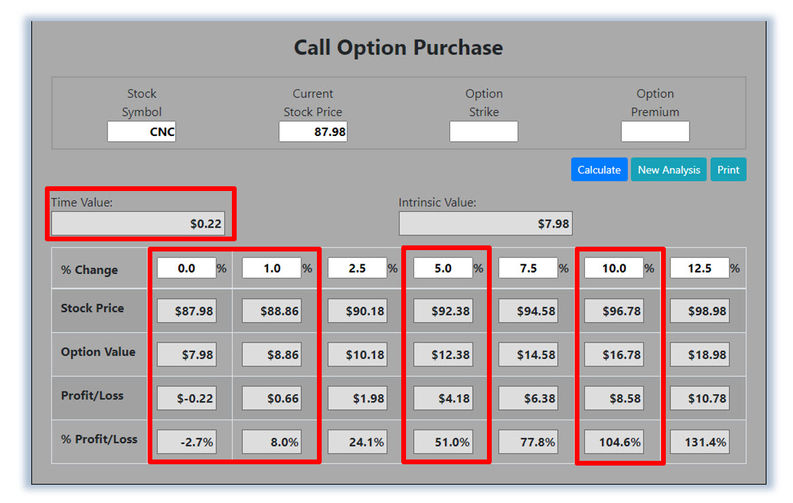
Confirmed ‘Buy’ Signal for CNC Since CNC's OBV line is sloping up, the most likely future price movement for CNC is up, making CNC a good candidate for a stock purchase or a call option purchase. Let's use the Hughes Optioneering calculator to look at the potential returns for a CNC call option purchase. The Call Option Calculator will calculate the profit/loss potential for a call option trade based on the price change of the underlying stock/ETF at option expiration in this example from a flat CNC price to a 12.5% increase. The Optioneering Team uses the 1% Rule to select an option strike price with a higher percentage of winning trades. In the following CNC option example, we used the 1% Rule to select the CNC option strike price but out of fairness to our paid option service subscribers we don’t list the strike price used in the profit/loss calculation. | 


0 Response to "Buying Pressure Sends CNC Higher"
Post a Comment