| WEEKLY ROUNDUP
This is the most dangerous chart in the financial markets… 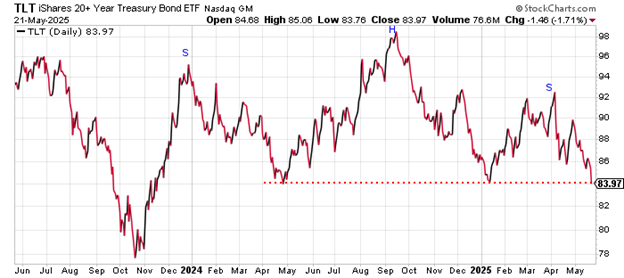
This is a chart of the iShares 20+ Year Treasury Bond Fund (TLT) from about a week ago. TLT is an exchange-traded fund that tracks the action in long-term Treasury Bonds. And it’s breaking down. Why is that dangerous? Because, as bond prices fall, longer-term interest rates rise. And rising rates are bad news for stock prices. Please understand, the Federal Reserve Board sets the target for short-term Federal Funds interest rates. That’s the rate over which stock market investors have been obsessing. That’s the rate most folks expect the Fed will cut two or three times this year. Bond investors determine what happens with longer-term interest rates. Based on the look of the above chart, TLT looks set to fall. That means longer-term rates are set to rise. TLT peaked in September 2024 near $99 per share. It then declined all the way to $84 in January, where it found support and bounced. That bounce ran out of steam last month. TLT has been falling for six straight weeks. Now it looks like TLT is set to lose the support of the $84 level. If that happens, we could see a quick drop to the October 2023 low near $78. That would put long-term interest rates near 5.6%, or even a bit higher. We haven’t seen long term rates that high in 20 years. And it’s happening at a time when the U.S. Treasury has to refinance trillions of dollars in maturing debt, and when the U.S. government is trying to pass a budget that will add trillions more to the deficit. Stock market investors have ignored this situation, so far. TLT is down 7% over the past six weeks. Yet, the S&P 500 is higher. Somebody is lying. Stocks and Treasury bonds typically move in the same direction. So, this sort of divergence is notable. One of these assets is due for an epic reversal. Either Treasury bonds need to rally to catch up with the action in stocks, or stocks are going to be pulled down to match the action in bonds. The widely accepted opinion on Wall Street is that bond investors are smarter than stock investors. We’ll soon find out if that’s true. Best regards and good trading, Jeff Clark
Editor, Market Minute Now, let’s take a look back at what we covered here at Smart Money this week… and what you can look forward to in your next issue. | 


0 Response to "The Most Dangerous Chart in the Market Right Now"
Post a Comment