You are a free subscriber to Me and the Money Printer. To upgrade to paid and receive the daily Capital Wave Report - which features our Red-Green market signals, subscribe here.
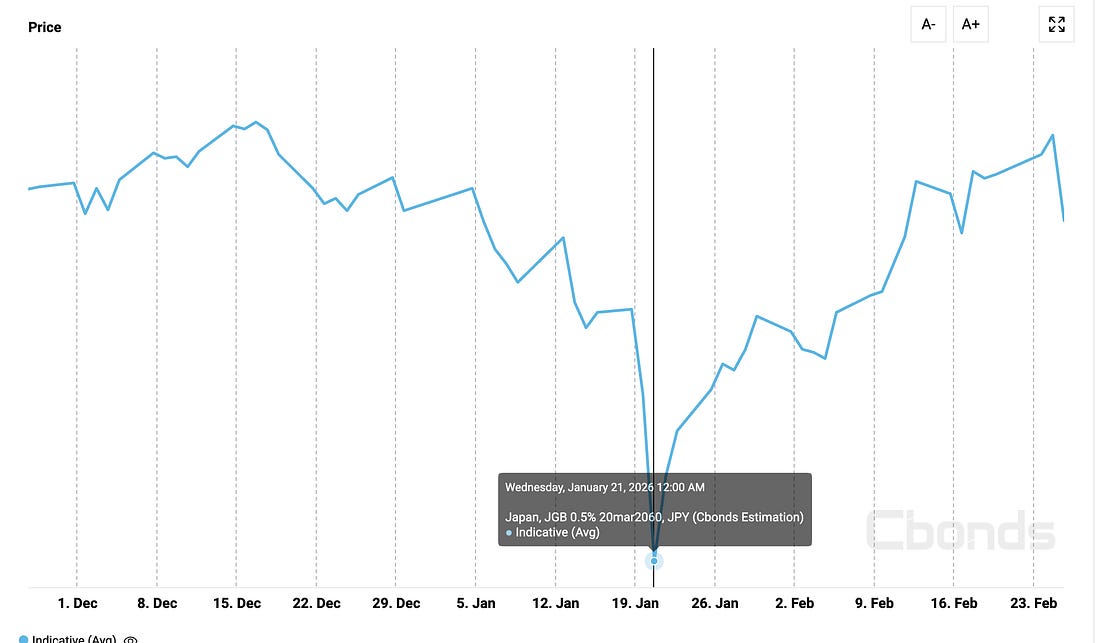
Dear Fellow Traveler: I watched the movie Shattered Glass again last night… It’s the story about former New Republic author Stephen Glass, who made up dozens of stories and nearly caused a collapse in the magazine. What’s interesting about that story isn’t just the lies he told in publication… but the lies he commits in trying to cover up his illusions... As you can tell… my mind is on the great fugazi. For the last week, I’ve been thinking about what’s been happening in this financial system. We’ve been told that the Fed has been fighting inflation… that it’s not printing money… that it’s operating in a neutral stance. And yet, here is a range-bound equity market. Everyone knows something is off. Private credit is screaming at us. Japan’s bond market is a mess. And software stocks are in a free fall. Blame AI all you want. But there’s something bigger here. I’ve been thinking about where this market would be if we weren’t providing - get this - about $525 billion to $650 billion in quantitative support. And, sometime around the time that Peter Sarsgaard was stealing this scene… I decided to give up. What would stocks and bonds look like if the government and central banks just stopped buying, backstopping, and changing the rules every time something cracks? I couldn’t answer it. Because the support system is so layered and constant and relentless, it’s almost impossible to consider what it’d look like without all the BRRRRRRRR. We’re in a financial crisis… and the policy response says so… People Have TriedBefore we talk about what’s happening now, let’s take a quick spin back to 2008… Bernanke had estimated that Quantitative Easing boosted output by 3% and saved two million jobs. Then, in 2012, he said that “the counterfactual... how the economy would have performed in the absence of the Federal Reserve’s actions... cannot be directly observed.” Which is wild, right? He was saying… we saved the world, but I can’t prove what would’ve happened if we hadn’t. Authors Blinder and Zandi argued that without the bailouts, the economy would have shrunk 14%. The Hoover Institution called bullshit on that one. Turns out that the entire estimate came from a single Moody’s model designed to show that government spending works. “It simply runs the policies through Zandi’s model and reports what the model says would happen,” the authors wrote. Then, in 2020, the Fed bought $75 billion in bonds per day. They expanded the balance sheet from $4.5 trillion to $7 trillion in weeks. Researchers tried to model what would have happened without it and gave up. Bernanke couldn’t do the math for 2008. Nobody could in 2020. Nobody can now. What the Fed Just DidWe’re now heading into our sixth month of real Fed intervention here… Back on October 14, 2025, Powell admitted “some signs have begun to emerge that liquidity conditions are gradually tightening.” Three days later, SOFR... the overnight rate underneath hundreds of trillions in contracts... spiked above the Fed’s own target. That’s like your thermostat reading jumping above the setting. It’s not supposed to happen. By October 31, the emergency lending window pumped $29.4 billion in one day. That was the biggest move since the early 2000s. Why? Because, as we warned, bank reserves were down at levels we hadn’t seen in years. Sounds like a healthy financial system, right? That’s where policy accommodation really kicked into gear. They ended Quantitative Tightening early. That had been $60 billion in bonds hitting the market each month. They turned around and started to buy T-bills through “Reserve Management Purchases”... Remember… that’s totally not Quantitative Easing… It’s just policy that looks like QE and aims to achieve QE-like outcomes… under a totally different name… as I predicted last summer. Then… the Fed removed its $500 billion daily cap on the emergency lending window... So, it’s unlimited now. Then, they renamed the facility because the old name made banks nervous. They effectively started a public relations campaign telling banks it was okay to use it. Then they changed capital rules for the eight biggest banks, freeing up $219 billion and making it more attractive for them to buy Treasuries... They changed the rules so banks would want to buy the thing the government is selling. As a result in all of this… liquidity has actually INCREASED this year. CrossBorder Capital said that Fed liquidity has jumped by 5% this year. The Reserve Management Purchases alone have totaled $133.8 billion since December 12, averaging $14 billion per week. The Fed’s SOMA account, which holds Treasury debt, is up $101.6 billion. It’s not Quantitative Easing, but as Howell said… It’s both “a ‘quantity’ and an ‘easing.’“ The main aim of the purchases is to support repo markets during periods such as the upcoming April tax season, when the Treasury’s account swells and drains liquidity from money markets. We should expect more buying in the weeks ahead, not less. That’s not all… the Treasury General Account... the government’s checking account at the Fed... dropped from its $984 billion peak in October to $839 billion, releasing cash into the system. Regulatory changes pushed the minimum reserve threshold from $3.25 trillion down to under $3 trillion. Howell estimates roughly $525 billion in extra liquidity has been injected into U.S. money markets in the past three months. Through deliberate policy actions that they’re calling maintenance… But I’ve got that figure a little higher than this on the global front… and there’s a reason for it… What Japan Just DidThere’s another side to this Japan’s central bank raised rates for the first time in decades... zero to 0.25%, then 0.50%, then 0.75%. They were supposed to be tapering bond purchases. Then the market blew up. On January 20, 2026, the 40-year yield blasts through 4% for the first time. The 10-year hits 2.35%, the highest since 1999. AIG stock fell sharply due to its exposure to this mess. The next day, Japan’s 2060 bond was trading for… 38% on the Yen… which is a distressed level for a nation that owns its own money printer.
Within 48 hours, the 30-year spiked 0.30 percentage points on trades so small... $170 million in 30-year bonds, $110 million in 40-year... that a $7.3 trillion market cascaded on pocket change. Takaichi called a snap election, promising $135 billion in stimulus. Won a landslide. Japan’s four biggest insurers are sitting on $86 billion in unrealized bond losses. The response was to slash bond issuance to a 17-year low. They then pitched accounting rules that would allow insurers to avoid reporting losses. Add all that to pressure to not raise interest rates, all on top of the $117 billion in stimulus announced in November 2025. If a $170 million in trades can crash a $7.3 trillion market, the problem isn’t the trades. It’s the market. And the fix hasn’t been to repair this system… It’s been just to change the rules so the losses don’t show up. What the Models SuggestI’m not going to pretend this is precise. But I’m trying. The academic literature offers a small direction… The standard estimate is 3-6 basis points of yield suppression per $100 billion in central bank purchases. Run that against $525 billion in injections, add the Japan contagion that would’ve hit without containment, and yields are meaningfully higher across the curve... probably half a percentage point or more on the long end. What that translates to in equities depends on assumptions nobody can verify, but the models suggest a market that’s materially lower than where we’re sitting. How much lower is unknowable... and anyone who gives you an exact number is running the same kind of model Blinder and Zandi ran. What’s not in dispute is the direction. Why Everyone’s BearishThe S&P’s been sideways… and the news says the economy’s fine. Earnings are fine. So why does the market feel stuck? Because it can feel what’s underneath it. With all this printing… we’re still sideways… And without it… What’s a fair estimate of where it should be? Maybe 15% lower? Maybe 18%… Based on the April 2025 downturn… the August 2024… the China crisis of early 2016? The GILT Crisis? Is 20% fair? Is 33%? It’s all a subjective debate… and it’s all built on the back of an illusion… UBS raised its private credit default estimate to 15%... a record for the $1.8 trillion market. We’re still 137 points from all-time highs on the S&P 500 (2%)… Blue Owl gated investors because AI is repricing its software loans. Bloomberg compared it to BNP Paribas in August 2007. Banks carry $1.3 trillion in exposure to non-bank lenders. People are buying the software dip… All while every support mechanism is now deployed. All except full-scale QE. The Fed is buying, the lending window is uncapped, Japan is spending, and the accounting rules have changed. The accounting is rewritten. The question isn’t where the stock market should be traded… It’s really… is this a free market? Is price discovery even allowed anymore? And what exactly are they protecting… how much of a house of cards is this? If it takes $525 billion in deliberate liquidity injections in three months, plus Japan changing its accounting rules so insurers don’t have to admit what their bonds are worth, plus an unlimited emergency lending facility, plus capital rule changes to manufacture demand for government debt... What are we actually pricing? I don’t have the answer… and I’m not going to pretend I can model it. Stay positive, Garrett Baldwin About Me and the Money Printer Me and the Money Printer is a daily publication covering the financial markets through three critical equations. We track liquidity (money in the financial system), momentum (where money is moving in the system), and insider buying (where Smart Money at companies is moving their money). Combining these elements with a deep understanding of central banking and how the global system works has allowed us to navigate financial cycles and boost our probability of success as investors and traders. This insight is based on roughly 17 years of intensive academic work at four universities, extensive collaboration with market experts, and the joy of trial and error in research. You can take a free look at our worldview and thesis right here. Disclaimer Nothing in this email should be considered personalized financial advice. While we may answer your general customer questions, we are not licensed under securities laws to guide your investment situation. Do not consider any communication between you and Florida Republic employees as financial advice. The communication in this letter is for information and educational purposes unless otherwise strictly worded as a recommendation. Model portfolios are tracked to showcase a variety of academic, fundamental, and technical tools, and insight is provided to help readers gain knowledge and experience. Readers should not trade if they cannot handle a loss and should not trade more than they can afford to lose. There are large amounts of risk in the equity markets. Consider consulting with a professional before making decisions with your money.
|


Subscribe to:
Post Comments (Atom)
0 Response to "Free Market? Or Freefall?"
Post a Comment