You are a free subscriber to Me and the Money Printer. To upgrade to paid and receive the daily Capital Wave Report - which features our Red-Green market signals, subscribe here.
Dear Fellow Traveler: This will sound ridiculous given everything we’ve been talking about... the repo injections and the Japanese bond meltdowns and the $525 billion in liquidity that nobody wants to call Quantitative Easing (QE). But I need a minute. Because tomorrow is March 1... The grass is being cut in Florida and Arizona, and somewhere right now, a 22-year-old kid who was pitching in Double-A last August is standing on a mound trying to throw a slider that breaks three inches more than it did in September. Nobody in the world is watching him except a pitching coach with a radar gun and a dream. Baltimore author and crank H.L. Mencken used to write about baseball the way others wrote about cathedrals. He’d go to Ebbets Field, the Polo Grounds, the old parks that smelled like peanut shells and cigar smoke and spilled beer on concrete... and he’d write about the geometry of it. He’d talk about the diamond, the distances, the “60 feet, six inches” from the mound to the plate, and 90 feet between the bases. Those numbers haven’t changed since 1893. People looked at these dimensions 133 years ago and said... That’s great. Leave it. There’s something in that. We spend most of our time now trying to understand markets and systems that are redesigned in real time. It feels like the Fed changes its balance sheet mechanics every quarter. Japan rewrote its accounting rules so insurance companies didn’t have to admit the value of their bonds. Private credit funds invented new structures to avoid marking losses. The rules have changed constantly… Baseball rarely does that (see the extra-innings rule, which has worked out). The strike zone moves around a little depending on who’s behind the plate, but the game is the game. You get three strikes, four balls, three outs, and nine innings. A .300 hitter is a .300 hitter in 1926 and in 2026, and when someone tells you a pitcher has a 2.85 ERA, you know exactly what that means without needing a footnote explaining that the methodology was revised in December. That’s why the statistics matter so much to people who love this sport. It’s not that we’re nerds... although we are... It’s that the numbers mean something because they’re measured against a fixed standard. A home run in 1955 and a home run today traveled over the same fence. In finance, we can’t even freaking agree on what inflation is. In baseball, a strikeout is a strikeout. There’s a clarity to that which borders on spiritual. My dad gave me my first pack of baseball cards in 1986. Topps. I remember flipping to the back of every card and reading the stats... batting average, home runs, RBIs, stolen bases... and not understanding most of it but understanding that these numbers described something real. Learning to read a box score was one of the first five things that my father taught me… and I still look at them all the time. Something that had happened on a field, in front of people, and been recorded and printed on the back of a card that I could hold in my hand…
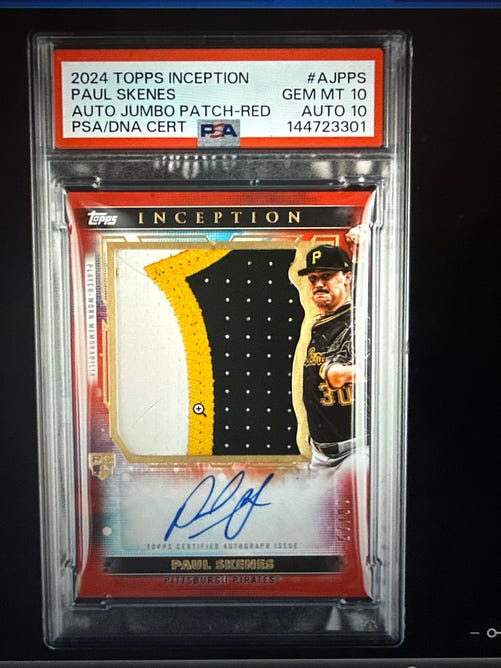
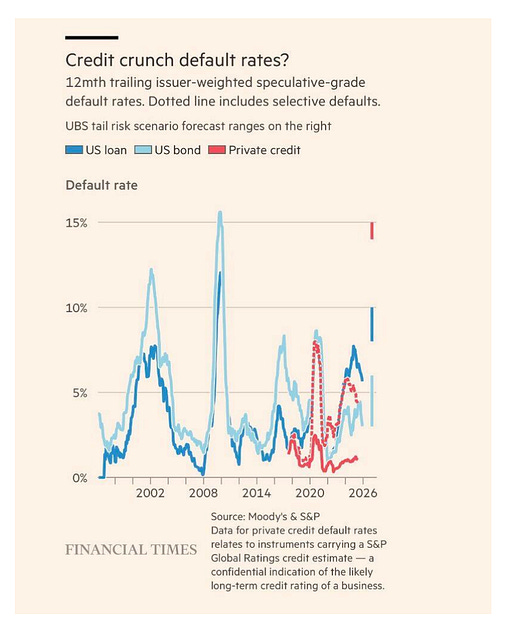
That’s what baseball cards and box scores are… They’re proof that the game happened and the rules were the same. That someone stood in a batter’s box on a Tuesday night in July and hit a ball over a wall, and it counted. It’s proof that Paul Skenes is the best pitcher in the game. In a world that increasingly feels managed, adjusted, revised, and rewritten... there’s something reassuring about a box score. I’m romanticizing a sport where grown men throw and catch a ball for money. I get it… But sometimes the simple thing is the true thing, and the true thing is worth protecting. Opening Day is March 27 this year (I don’t like counting those games in Japan…) That’s 27 days from now… someone is going to throw the first pitch of the season, and for a few hours the world is going to be organized around something that makes sense. It’ll all be binary… Fair or foul. Safe or out. Win or lose. There won’t be any footnotes, revised methodology, or “technical adjustments.” Fathers are going to sit next to sons and daughters in stadiums across the country, and those fathers are going to try to explain the infield fly rule, and fail, because nobody can explain the infield fly rule on the first try. And on Opening Day, my daughter will eat a hot dog and not care, and remember the day forever anyway. That’s the transaction. A kid, a hot dog, and a game that hasn’t changed. I’ve spent months writing about systems that require $525 billion in coordinated intervention to stay upright. I keep rambling about systems where the rules get rewritten so losses don’t show up. We live in a place where the question “is this a free market?” doesn’t get an answer. Baseball’s market is pretty free… You stand in the box, and the pitch comes. You swing, or you don’t. And nobody adjusts the outcome after the fact. Nobody reclassifies a strikeout as a “technical adjustment to the batter’s performance metric.” You’re out, or you’re safe, and it’ll be the same box score in 50 years. I love simplicity… Now… let’s look at the charts… Chart No. 1: We’re In a Financial Crisis… Act Like ItWe’re doing five charts today that are really important. I’ve been saying that the data shows we’re in a financial crisis… Not a 1929 Depression. Not a 2008 implosion. But a real financial event with liquidity under pressure and defaults rising. This is the UBS number we wrote about in "Is This a Free Market?" Matthew Mish raised his worst-case projection for private credit defaults to 15% in late February, up from 13% just four weeks earlier. This red line is pretty intimidating...
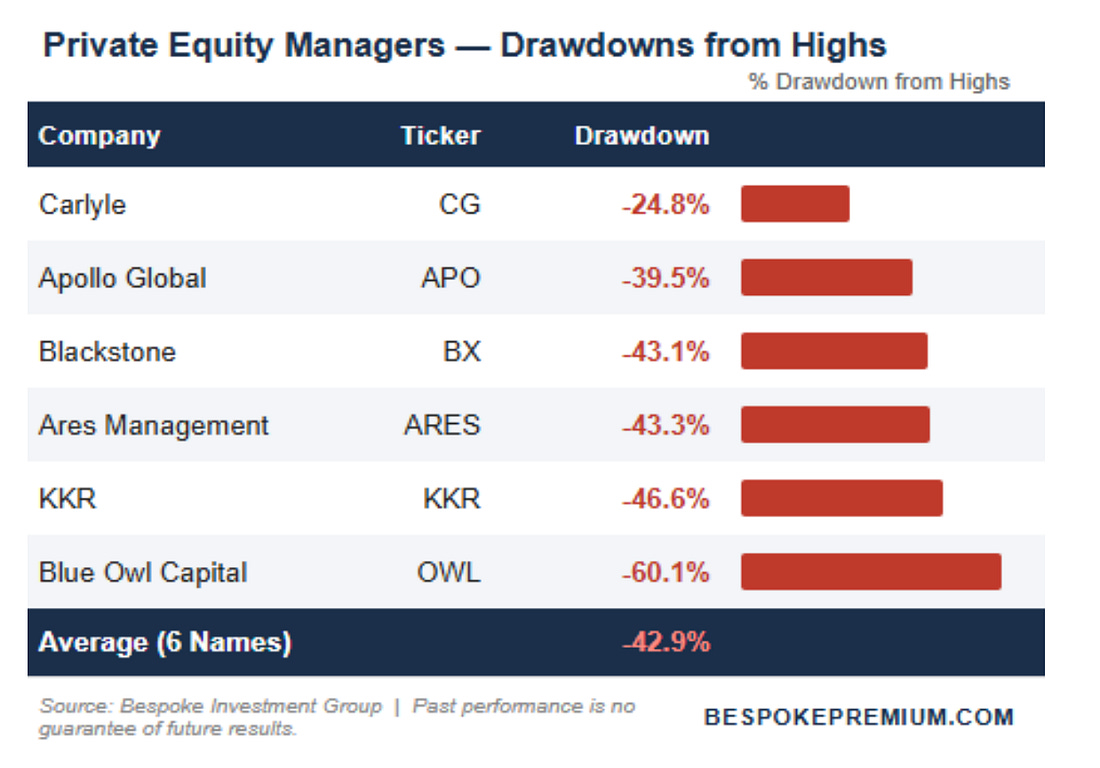
That’s the tail risk forecast ranges… Remember, Blue Owl has already gated investors in OBDC II because its software loan book is being repriced amid AI disruption. Bloomberg compared it to BNP Paribas freezing funds in August 2007... Are we going to act like we’re in a crisis yet? The $525 billion in liquidity injections that Howell tracked at CrossBorder Capital... the RMPs, the TGA drawdown, the eSLR changes... all of that is already deployed. Remember… this chart is what the market looks like with the safety net. Chart No. 2: Private Equity Isn’t Out of the Woods YetBlue Owl at -60.1% from highs tells you everything… It’s ugly out there… This is the company that gated investors. The one with 45% of its Technology Income Corp book in software loans. The others aren't much better... KKR at -46.6%, Blackstone and Ares both down 43%. The average drawdown across six names is -42.9%.
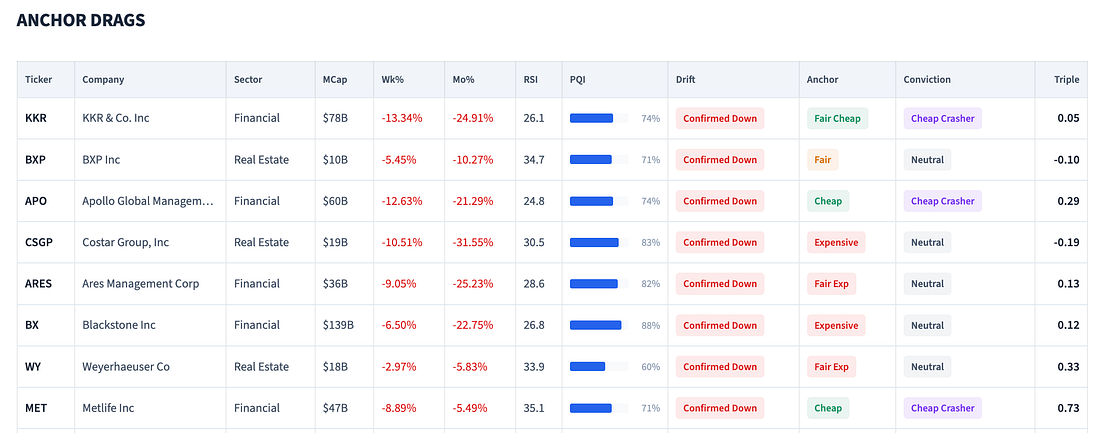
And every single one shows “Confirmed Down” on momentum. Momentum is still extremely bad on our Triples dashboard… which we’ll be unveiling soon as its own independent tool… KKR has been on this list since shares were trading at $107… and people were trying to call the bottom then.
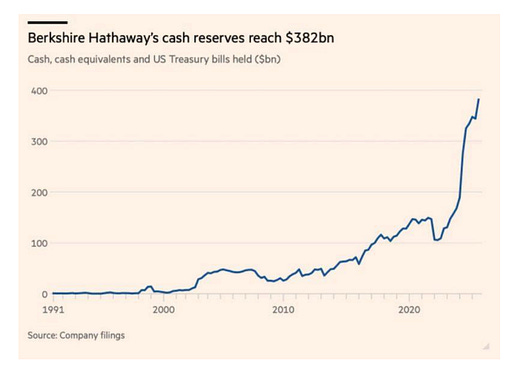
And KKR has dropped even though we saw massive amounts of insider buying. What we’re looking at is an important screen. Insiders might buy… but momentum isn’t returning. The same thing happened to WY and APO. Insiders bought… and the rebound hasn’t happened. Don’t try to call a bottom if anything is on this list… Momentum doesn’t lie. Chart No. 3: Berkshire’s Cash is a Curse… Not a BlessingThere’s a lot of fascination with this chart. It’s the amount of cash that Berkshire has sitting on its balance sheet. Sure, for right now, it’s just collecting interest thanks to ongoing management and Treasuries. But this is a lot of money doing… what?
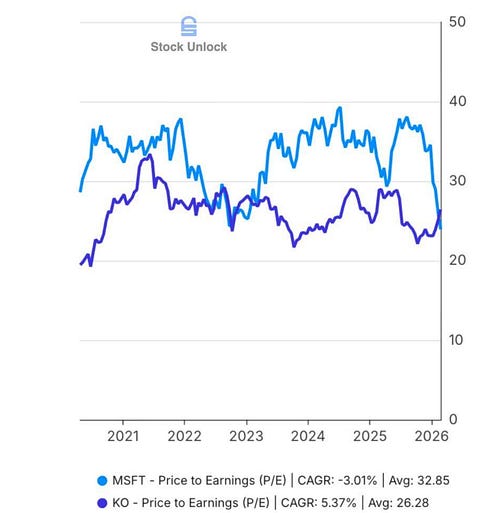
There’s a bit of a curse to having all this cash. How do you deploy it? Valuations are stretched, and it’s hard to expect that earnings would be accretive. Howell's data shows liquidity is being deliberately channeled into Main Street through "Treasury QE," not Wall Street. Commercial bank credit up 6.8%, M2 up 4.5%, but equity markets are going sideways. Buffett's cash pile isn't patience. It's a verdict. Chart No. 4: I Swear P/E Ratios are UselessAs I noted last week, Walmart’s PE ratio is higher than NVIDIA’S. Here’s a visual of Coca-Cola against Microsoft…
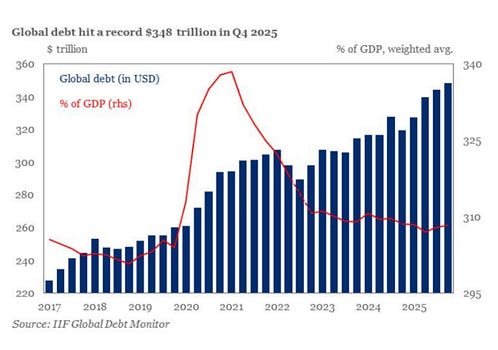
PE ratios are dumb… sorry… Use EV/EBIT to measure stocks. Look at the full capital structure. PE ratios are weird. I’m not a fan. Chart No. 5: So, When Do We Get a New Monetary SystemHey… not big deal. Global debt just surged to $348 billion… This is the chart that connects everything we've been writing about. Japan's $7.3 trillion bond market cascading on $170 million in trades... that's a symptom of this.
At $348 trillion, the debt is the system. And it can create deflationary pressures… if liiquidity isn’t ample and refinancing it’s available. This chart is why more printing is coming… You can’t shrink it without breaking it. You can’t service it without suppressing rates. And you can’t suppress rates without the kind of coordinated intervention we’ve talked about… At $348 trillion in global debt, “new Bretton Woods” isn’t hyperbole. It’s arithmetic. Buy the chokepoints and the things that aren’t nailed down… All right… We all had a great time. My month-long fantasy baseball draft starts in 30 minutes… and I have the No. 2 pick… Looks like I’m gonna be rooting for Aaron Judge a lot this season… Stay positive, Garrett Baldwin About Me and the Money Printer Me and the Money Printer is a daily publication covering the financial markets through three critical equations. We track liquidity (money in the financial system), momentum (where money is moving in the system), and insider buying (where Smart Money at companies is moving their money). Combining these elements with a deep understanding of central banking and how the global system works has allowed us to navigate financial cycles and boost our probability of success as investors and traders. This insight is based on roughly 17 years of intensive academic work at four universities, extensive collaboration with market experts, and the joy of trial and error in research. You can take a free look at our worldview and thesis right here. Disclaimer Nothing in this email should be considered personalized financial advice. While we may answer your general customer questions, we are not licensed under securities laws to guide your investment situation. Do not consider any communication between you and Florida Republic employees as financial advice. The communication in this letter is for information and educational purposes unless otherwise strictly worded as a recommendation. Model portfolios are tracked to showcase a variety of academic, fundamental, and technical tools, and insight is provided to help readers gain knowledge and experience. Readers should not trade if they cannot handle a loss and should not trade more than they can afford to lose. There are large amounts of risk in the equity markets. Consider consulting with a professional before making decisions with your money.
|


Subscribe to:
Post Comments (Atom)
0 Response to "The One Constant (Is Chart Party)"
Post a Comment