The Best Business in the World Just Had Its Worst Month Since 2000

Trade of the Day Wake-Up Watchlist

"I don't trade businesses. I trade charts. And right now, the Microsoft chart is telling me something very specific."

Nate Bear, Lead Technical Tactician, Monument Traders Alliance

Nate Bear

Here's a question for you…

What do you do when a company beats earnings eight quarters in a row... and the stock drops 24% anyway?

Most people freeze. They stare at the fundamentals, scratch their heads, and wonder how a business growing revenue 16–18% year over year can possibly be down that much. They trust the business and ignore the chart.

That's the mistake.

I don't trade businesses. I trade charts. And right now, the Microsoft (MSFT) chart is telling me something very specific.

The Trend Nobody Wants to Say Out Loud

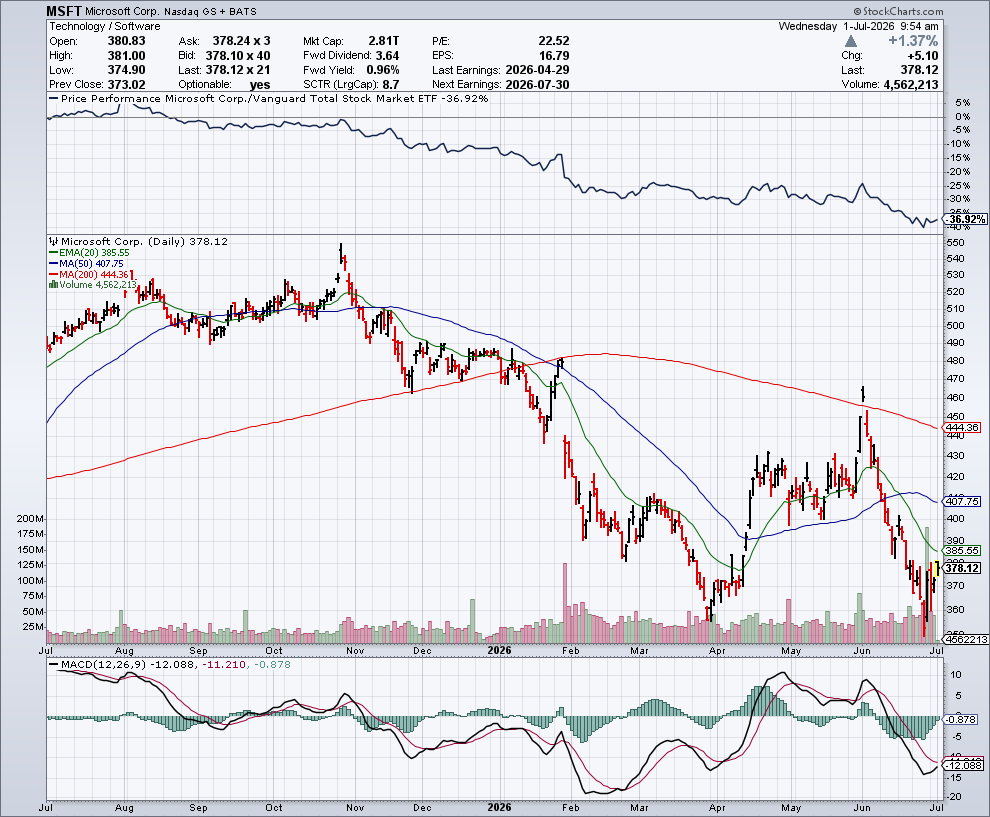
June 2026 was Microsoft's worst month since December 2000. Down roughly 20% in a single month. Worst first half of a year in a quarter century. Down 24% YTD while the S&P 500 is up 7%.

The reasons aren't hard to find.

Microsoft is projected to spend $190 billion on AI infrastructure in fiscal 2026, and Wall Street is starting to ask whether the returns will ever justify that number.

Physicists published a critique in Nature questioning the scientific foundation of Microsoft's quantum computing roadmap.

Xbox hardware revenue fell 33% year over year.

Layoffs are coming, possibly affecting 2.5% of the workforce.

Meanwhile, the underlying business keeps beating estimates.

That disconnect (great fundamentals, terrible stock performance) is exactly the kind of confusion that creates a squeeze.

The trend is clear: lower highs, lower lows, price below both the 50-day and 200-day moving averages. From an all-time high near $555 to roughly $373 today. That's the trend. Don't fight it.

The Pattern Is a Pivot Point

MSFT hit a pivot bottom on June 25 at approximately $349. Since that low, the stock has bounced up about 5–6% in the final days of June. That bounce is now being tested.


SPONSORED

What's Trump Got Up His Sleeve?

Click here to discover what one expert is calling "Trump Royalty Income."

I'm watching a potential lower-low-to-higher-low sequence forming off the $349 base.

If MSFT can hold above that level and start building higher lows into earnings, the pattern shifts from bearish continuation to potential base-building.

But if $349 breaks? The chart points toward $320–$330 and there's not much structural support between here and there.

This is a two-sided setup. I want to be straight with you about that.

The Squeeze Is Loading Into Late July Earnings

This is what I'm focused on most.

After a 20% single-month decline, volatility has compressed. The stock is now grinding sideways in a tightening range between roughly $367 and $375. Bollinger Bands are narrowing. The spring is coiling.

And the timer is right there on the calendar: July 29 earnings.

That's three and a half weeks away. Every day that passes without a directional move is another red dot stacking on the squeeze indicator.

The energy is building. And when Microsoft reports (Azure growth numbers, Copilot monetization data, guidance on that $190 billion capex plan) this squeeze fires.

The direction depends on what they say. But the magnitude of the move? The squeeze is already telling you it's going to be significant.

One More Thing: The Form 4s

According to recent SEC filings, insiders have sold $10.5 million worth of MSFT shares over the past three months, with 13 distinct insiders executing transactions totaling a net negative capital flow of nearly $144 million.

The lone bright spot: director John W. Stanton made an open-market purchase of 5,000 shares back in February at $397.35, before the June selloff.

That's one buyer against a wall of sellers. Not the insider picture you want to see if you're leaning bullish.

Your Action Plan

MSFT is a squeeze setup with a hard catalyst date and a messy insider picture. That tells me one thing: patience.

I'm not chasing this in either direction before earnings. What I am doing is watching $349 as the line in the sand.

Hold it through July and the base-building thesis has a chance. Lose it and the squeeze fires downward hard.

The business is great. The chart is complicated. And July 29 is going to tell us which one wins.

I'll be watching.

If you want to follow along in real time, join me in Daily Profits Live, where we've closed nearly 70 trades this month, with a win rate of 76%.

Want more content like this?
Like button Dislike button

SPONSORED

Nvidia's Next Great AI Leap?

Gallium Nitride
 

The chipmaking giant just partnered with a tiny stock that holds 250 patents on a record-breaking new tech.

This tech uses up to 40% less energy than silicon… with a performance boost up to 100-fold!

Here's why this tiny stock could be the #1 stock of the next year.

Subscribe to receive free email updates:

0 Response to "The Best Business in the World Just Had Its Worst Month Since 2000"

Post a Comment