| June 10th, 2021 Profit 113.5% if EWL is up 10.0% Dear Reader, Yesterday, we looked at a Daily Price Chart of DCP Midstream LP, noting that DCP’s 50-Day EMA is trading above the 100-Day EMA signaling a ‘Buy’. For today’s Trade of the Day we will be looking at an On Balance Volume chart for the iShares MSCI Switzerland Capped ETF, symbol: EWL. Before breaking down EWL’s OBV chart let’s first review the investment objective of the ETF. The EWL ETF seeks to track the investment results of the MSCI Switzerland 25/50 Index. The fund will at all times invest at least 80% of its assets in the securities of its underlying index and in depositary receipts representing securities in its underlying index. Confirming a Price Uptrend with OBV The EWL daily price chart below shows that EWL is in a price uptrend as the current price is above the price EWL traded at six months ago (circled). The On Balance Volume chart is below the daily chart. On Balance Volume measures volume flow with a single Easy-to-Read Line. Volume flow precedes price movement and helps sustain the price uptrend. When an ETF closes up, volume is added to the line. When an ETF closes down, volume is subtracted from the line. A cumulative total of these additions and subtractions form the OBV line. On Balance Volume Indicator ● When Close is Up, Volume is Added ● When Close is Down, Volume is Subtracted ● A Cumulative Total of Additions and Subtractions form the OBV Line Volume flow precedes price and is the key to measuring the validity and sustainability of a price trend. We can see from the OBV chart below that the On Balance Volume line for EWL is sloping up. An up-sloping line indicates that the volume is heavier on up days and buying pressure is exceeding selling pressure. Buying pressure must continue to exceed selling pressure in order to sustain a price uptrend. So, On Balance Volume is a simple indicator to use that confirms the price uptrend and its sustainability. The numerical value of the On Balance Volume line is not important. We simply want to see an up-sloping line to confirm a price up trend. 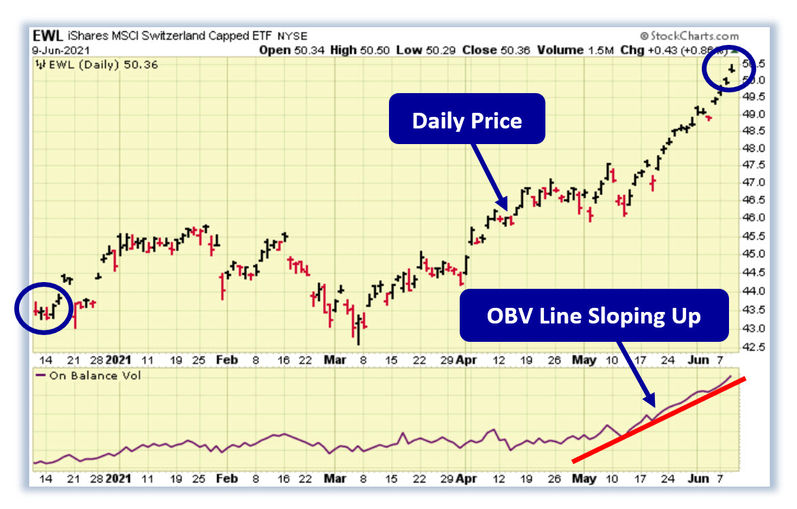
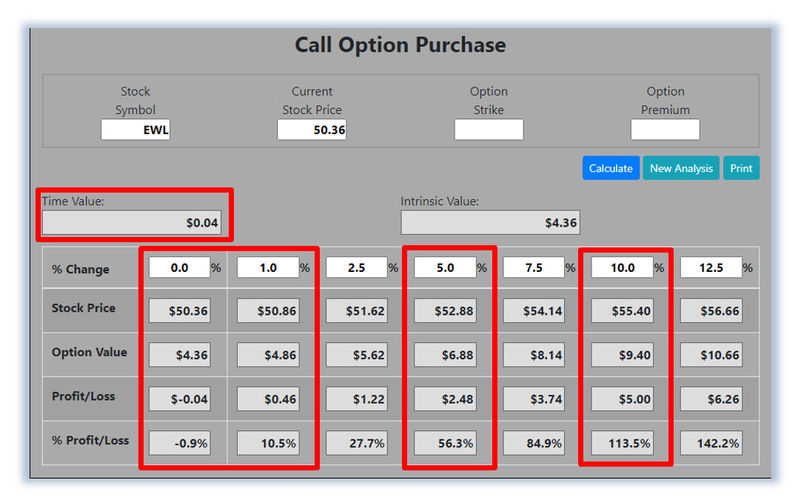
Confirmed ‘Buy’ Signal for EWL Since EWL's OBV line is sloping up, the most likely future price movement for EWL is up, making EWL a good candidate for an ETF purchase or a call option purchase. Let's use the Hughes Optioneering calculator to look at the potential returns for an EWL call option purchase. The Call Option Calculator will calculate the profit/loss potential for a call option trade based on the price change of the underlying stock/ETF at option expiration in this example from a flat EWL price to a 12.5% increase. The Optioneering Team uses the 1% Rule to select an option strike price with a higher percentage of winning trades. In the following EWL option example, we used the 1% Rule to select the EWL option strike price but out of fairness to our paid option service subscribers we don’t list the strike price used in the profit/loss calculation. Our initial price target for the EWL ETF is 54.10 per share. | 


0 Response to "Profit 113.5% if EWL is up 10.0%"
Post a Comment