| September 8th, 2021 Increased Buying Pressure for NET Dear Reader, Yesterday, we looked at a Daily Price Chart of the Direxion Daily Technology Bull 3X ETF, noting that TECL’s 50-Day EMA is trading above the 100-Day EMA signaling a ‘Buy’. For today’s Trade of the Day we will be looking at an On Balance Volume chart for Cloudflare Inc. stock symbol: NET. Before breaking down NET’s OBV chart let’s first review which products and services are offered by the company. CloudFlare, Inc. operates a cloud platform that delivers a range of network services to businesses worldwide. The company provides an integrated cloud-based security solution to secure a range of combination of platforms, including public cloud, private cloud, on-premise, software-as-a-service applications, and Internet of Things (IoT) devices. Its security products comprise cloud firewall, bot management, distributed denial of service, IoT, SSL/TLS, secure origin connection, and rate limiting products. Confirming a Price Uptrend with OBV The NET daily price chart below shows that NET is in a price uptrend as the current price is above the price NET traded at five months ago (circled). The On Balance Volume chart is below the daily chart. On Balance Volume measures volume flow with a single Easy-to-Read Line. Volume flow precedes price movement and helps sustain the price uptrend. When a stock closes up, volume is added to the line. When a stock closes down, volume is subtracted from the line. A cumulative total of these additions and subtractions form the OBV line. On Balance Volume Indicator ● When Close is Up, Volume is Added ● When Close is Down, Volume is Subtracted ● A Cumulative Total of Additions and Subtractions form the OBV Line Volume flow precedes price and is the key to measuring the validity and sustainability of a price trend. We can see from the OBV chart below that the On Balance Volume line for NET is sloping up. An up-sloping line indicates that the volume is heavier on up days and buying pressure is exceeding selling pressure. Buying pressure must continue to exceed selling pressure in order to sustain a price uptrend. So, On Balance Volume is a simple indicator to use that confirms the price uptrend and its sustainability. The numerical value of the On Balance Volume line is not important. We simply want to see an up-sloping line to confirm a price up trend. 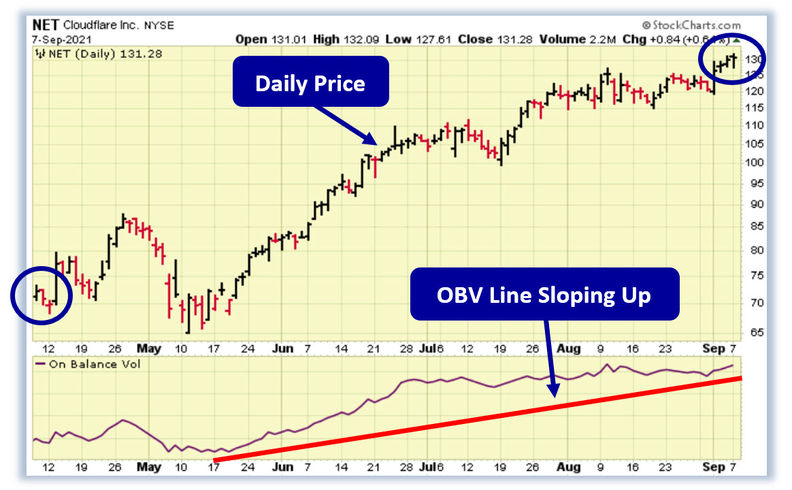
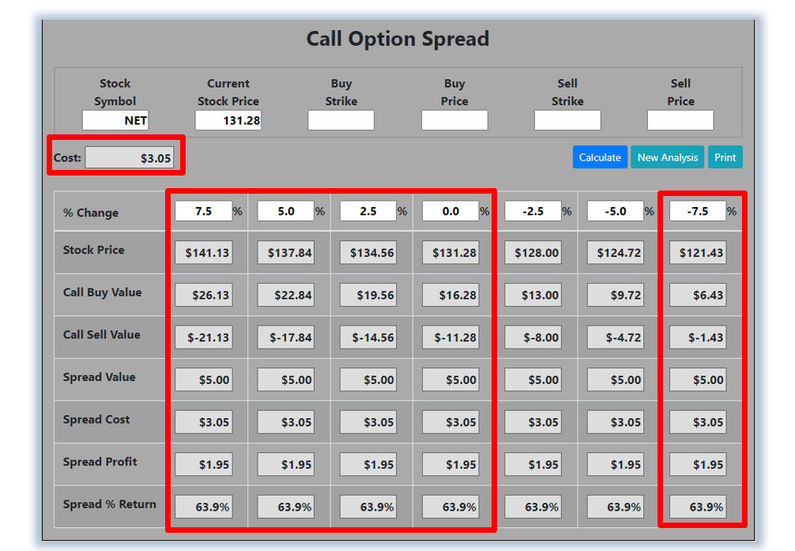
Confirmed ‘Buy’ Signal for NET Since NET's OBV line is sloping up, the most likely future price movement for NET is up, making NET a good candidate for a stock purchase or a debit spread trade. Let's use the Hughes Optioneering calculator to look at the potential returns for a NET debit spread. The Call Option Spread Calculator will calculate the profit/loss potential for a call option spread based on the price change of the underlying stock/ETF at option expiration in this example from a 7.5% increase to a 7.5% decrease in NET stock at option expiration. The goal of this example is to demonstrate the ‘built in’ profit potential for option spreads and the ability of spreads to profit if the underlying stock is up, down or flat at option expiration. Out of fairness to our paid option service subscribers we don’t list the option strike prices used in the profit/loss calculation. The prices and returns represented below were calculated based on the current stock and option pricing for NET on 9/7/2021 before commissions. | 


0 Response to "Increased Buying Pressure for NET"
Post a Comment