| February 3rd, 2022 Buying Pressure Pushes HSBC Higher Dear Reader, Yesterday, we looked at a Monthly Price Chart of AmerisourceBergen Corp., noting the stock’s 1-Month Price is trading above the 10-month SMA signaling a ‘Buy’. For today’s Trade of the Day we will be looking at an On Balance Volume chart for HSBC Holdings PLC stock symbol: HSBC. Before breaking down HSBC’s OBV chart let’s first review which products and services are offered by the company. HSBC Holdings plc provides banking and financial services worldwide. The company operates through Wealth and Personal Banking, Commercial Banking, and Global Banking and Markets segments. The Wealth and Personal Banking segment offers retail banking products and services, including current and savings accounts, mortgages and personal loans, credit and debit cards, and local and international payment services for ultra high net worth individuals; and wealth management services comprising insurance and investment products, global asset management services, investment management, and private wealth solutions. Confirming a Price Uptrend with OBV The HSBC daily price chart below shows that HSBC is in a price uptrend as the current price is above the price HSBC traded at six months ago (circled). The On Balance Volume chart is below the daily chart. On Balance Volume measures volume flow with a single Easy-to-Read Line. Volume flow precedes price movement and helps sustain the price uptrend. When a stock closes up, volume is added to the line. When a stock closes down, volume is subtracted from the line. A cumulative total of these additions and subtractions form the OBV line. On Balance Volume Indicator ● When Close is Up, Volume is Added ● When Close is Down, Volume is Subtracted ● A Cumulative Total of Additions and Subtractions form the OBV Line Volume flow precedes price and is the key to measuring the validity and sustainability of a price trend. We can see from the OBV chart below that the On Balance Volume line for HSBC is sloping up. An up-sloping line indicates that the volume is heavier on up days and buying pressure is exceeding selling pressure. Buying pressure must continue to exceed selling pressure in order to sustain a price uptrend. So, On Balance Volume is a simple indicator to use that confirms the price uptrend and its sustainability. The numerical value of the On Balance Volume line is not important. We simply want to see an up-sloping line to confirm a price up trend. 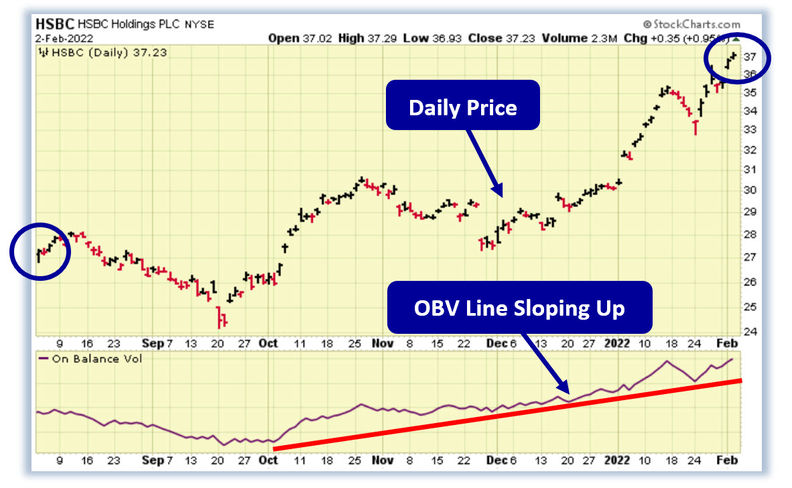
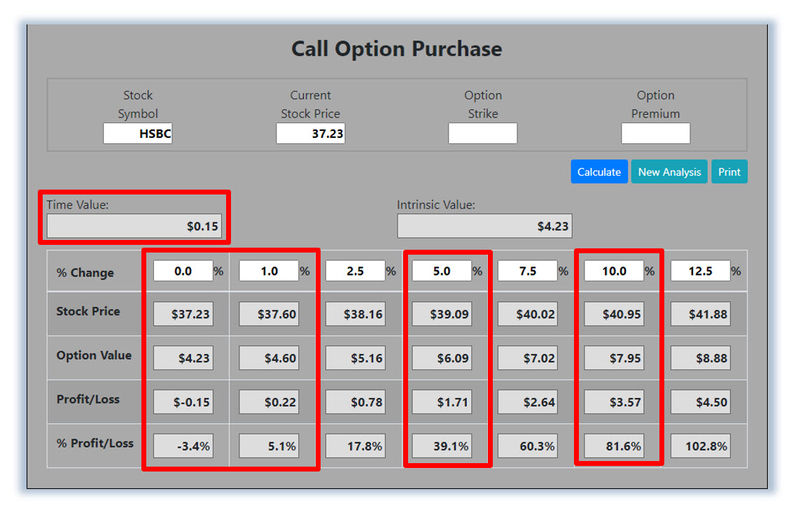
Confirmed ‘Buy’ Signal for HSBC Since HSBC's OBV line is sloping up, the most likely future price movement for HSBC is up, making HSBC a good candidate for a stock purchase or a call option purchase. Let's use the Hughes Optioneering calculator to look at the potential returns for an HSBC call option purchase. The Call Option Calculator will calculate the profit/loss potential for a call option trade based on the price change of the underlying stock/ETF at option expiration in this example from a flat HSBC price to a 12.5% increase. The Optioneering Team uses the 1% Rule to select an option strike price with a higher percentage of winning trades. In the following HSBC option example, we used the 1% Rule to select the HSBC option strike price but out of fairness to our paid option service subscribers we don’t list the strike price used in the profit/loss calculation. | 


0 Response to "Buying Pressure Pushes HSBC Higher"
Post a Comment