Ticker Reports for May 28th

GameStop Will Rocket Higher: The Move Won't Last
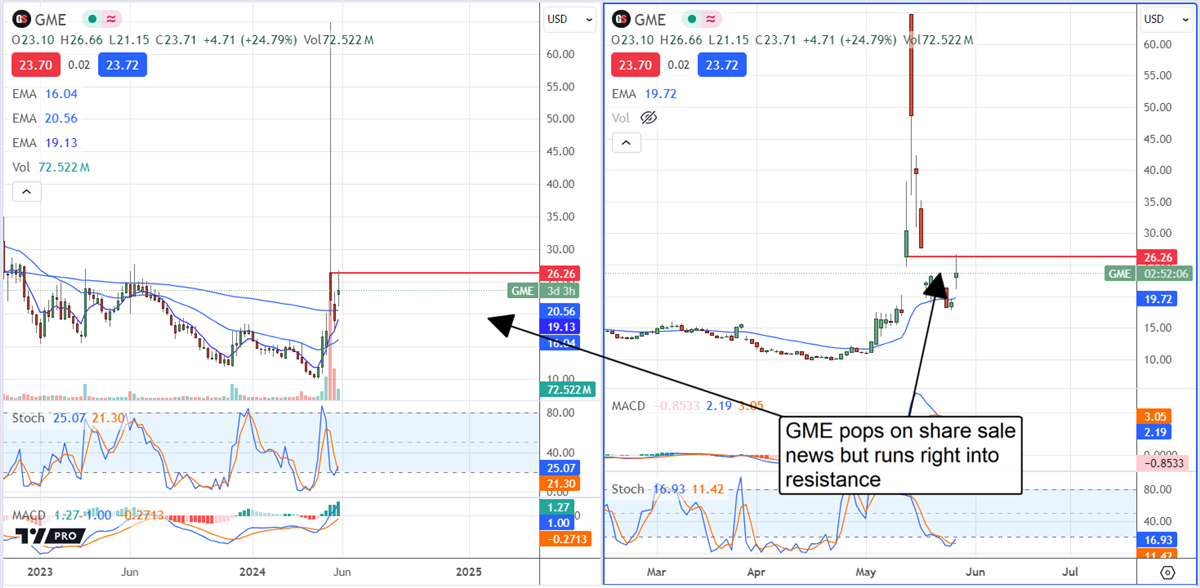
Shares of GameStop (NYSE: GME) are set up to rocket higher again, but the move won’t last because of why it is moving. GameStop announced a share sale that has increased its capital but diluted its value. The sale maxed out the shelf-offering filed only a week before, raising $933 million but diluting its stock by 15%.
The Ugly Truth About GameStop’s Capital Raise
The purpose for GameStop’s new funds is listed as general corporate purposes or investing, either of which is a possibility and not all that great for investors. The company has improved its cash burn but is still bleeding. It may not return to full-year profitability as forecasted, so it needs to remain well-capitalized to fund operations. The cash injection nearly doubled the year-end balance and could sustain losses for the next decade. The question is how a decade of losses will impact the share price, and the answer is negative.
The other purpose, investing, is more interesting. The board approved new policies that allow the company to invest in stocks and for those investments to match CEO Ryan Cohen’s. This opens the door to many opportunities, including capital gain and income, as well as risks.
CEO Ryan Cohen made a name for himself as an investor, but his two current holdings, GameStop and Bed Bath & Beyond, have performed poorly since his investment. BBBY shares are down nearly 100%, and GameStop's future is questionable; there’s no guarantee new investments will do any better.
While a capital increase is good news for the business, it is still in terrible shape with no signs of improvement, and now there are more shares for investors to contend with. Now, the best traders can expect is another short-covering rally that will likely fail because there is no fundamental reason to own the stock. Technical resistance to higher prices is so significant that GameStop may be unable to sustain a higher price until there is a significant improvement in operations, which is unlikely to come soon.
Don’t Buy Into RFK Jr Support for GameStop
RFK Jr gamed the GameStop market as surely as the meme traders when he threw in his support. The move is politically driven, meant to attract a meme-following, and has no bearing on operations. The $24,000 investment is only 0.35% of the market cap and intended as a launch pad for promotion - Mr. Kennedy pointed out the funds' source was profit from winning his case against Monsanto. Don’t count on his support moving the needle for GameStop or increasing the stock price.
There has been some positive movement regarding analysts' sentiment, but even that will not support the price action. The single analyst with a rating remains Wedbush, which rates the stock as a Strong Sell and raised its target to $7 from $5.60, 75% below the current price action. This situation is unlikely to change and keeps serious investment money out of this peripheral tech market.
GameStop Already Shows Signs of Resistance
GameStop could pop and even double in price due to another meme-induced rally, but there is a risk. The market already shows resistance at a critical level and may not move higher. In this scenario, the impact of the recapitalization effort is over, and the ceiling is already in place. The critical resistance is near $25, which has capped gains in the past. Assuming the market can move above $25, it could move as high as $65, but that is not expected.
The next visible catalyst is the Q1 report, due in early June. The risk is that analysts continue to overestimate, setting the stage for significant underperformance. The analysts lowered their targets following the Q1 guidance update, but not low enough to align with management's forecast.

The Tesla Indicator is saying buy.
If you ever thought you're too late to see significant returns from Tesla stock…
Please read this short email.
Because a world class trading expert just showed me an entirely new way to target hefty returns inside shares of Tesla.
It's all thanks to one unique trade setup that's specific to this legendary stock.
It's called the Perfect Tesla Trade.
And it couldn't be more straightforward…

Momentum Investing: A Guide to Getting Started
Part of Isaac Newton’s second law of motion says a body in motion remains in motion unless acted on by an outside force, and this covenant of physics has plenty of parallels with momentum investing. Momentum investing isn’t about finding stocks about to pop or drop but riding an established wave until the shoreline comes into view.
Momentum investors tend to have shorter timelines than buy-and-hold investors and use different tools when analyzing stocks. They also take on more risk than traditional investors, so grasping the techniques and tools needed for success is vital. In this article, you’ll learn the inner workings of momentum investing, the benefits and risks of this strategy and how to get started with your momentum portfolio.
What Is Momentum Investing?
If bodies in motion stay in motion, do stocks in an uptrend stay in an uptrend? That’s the theory behind momentum investing, which seeks to profit from trends already in motion rather than predicting reversals or changes in direction. Momentum investors use technical indicators to find stocks with solid trend continuance signals and buy shares to ‘ride the wave.’
The direction of the trend isn’t crucial; momentum investors can buy stocks trending up or down depending on market conditions. The essential data comes from the trend's strength, which is where the term momentum comes in.
How much momentum is in the trend? Is the wave of buying or selling continuing to grow, or is volume beginning to dry up? Long-term investors may not be concerned with volume and trend data, but momentum investors need technical tools and concepts like support and resistance to time their trades.
Momentum trading timelines can be hours, days, weeks or even months. But momentum strategies aren’t meant for investors looking to ‘set-and-forget’ their portfolios. Momentum traders must stay on top of the data and have the agility to exit a position should the charts sway from the thesis.
How to Get Started with Momentum Investing
Momentum investing isn’t a secret sauce used by pros and institutions. All you need to get started is capital and a trading account. But to successfully trade momentum, you’ll need a comprehensive understanding of a few technical indicators and a well-devised trading plan to keep your emotions from interfering with the process.
Set Up Your Trading Account
You’ll need a brokerage account to trade stocks, but not all brokers provide the same services. Momentum trading requires utilizing charting tools, indicators and different order types, so select a broker that offers the features you need.
What should you look for in a broker? To start, you’ll want a robust trading platform; pick a broker with an intuitive interface, functional mobile app and the ability to buy and sell a wide range of securities. And while most firms today offer commission-free stock trading, there’s still a schedule of fees to compare when selecting a broker. The more suitable your broker, the better experience you’ll have trading stock online.
Use the Right Tools and Indicators
Once you’ve chosen a broker and opened an account, you’ll need to familiarize yourself with the tools of the momentum trade. Moving averages are a crucial component of many momentum indicators since they help smooth out price data over short timeframes to identify trends better. For example, if a stock is trading above its 50- and 200-day moving averages, that’s evidence that the uptrend has room to continue.
You’ll want to learn how to use continuation-spotting tools like the Relative Strength Index (RSI) in your research. The RSI uses short-term daily highs and lows of a specific asset price to measure the velocity or strength of a trend. Readings between 30 and 70 on the RSI scale indicate the trend is likely to continue. Other critical technical indicators include the Moving Average Convergence Divergence (MACD) and Average Directional Index (ADX).
Develop a Trading Plan
Momentum investing requires a plan tailored to your specific goals. Your risk tolerance and investing timeline will play a prominent role in deciding which assets you trade and how long you hold them.
Before opening any positions, set profit goals and loss limits. If you plan to take profits after a 20% gain beforehand, you’ll be less inclined to make a potentially poor decision by hanging on. Also, consider your ideal entry and exit points before buying shares, as short-term trading strategies require precision for maximum gains.
Monitor and Adjust Your Strategy
Remember that Mr Market tends to laugh at our carefully laid plans. Momentum trading plans shouldn’t be static, and you must be ready to pivot if the market or economic environment changes. Many market prognosticators called for a recession in 2023; when that didn’t materialize, the investors who quickly pivoted to buying tech stocks were rewarded.
Short-term trading strategies require a more watchful eye than long-term ones. Momentum traders constantly review their charts, consume financial news and chat with other traders to confirm or adjust their views. Market conditions can change quickly, and stubborn investors won’t last long using momentum techniques.
Risks and Limitations of Momentum Investing
Newton’s second law of motion has a crucial caveat: “unless acted upon by an outside force.” Unfortunately for investors, outside forces are plentiful in markets and the economy. Since momentum investors have shorter timelines than long-term investors, risk increases because volatility, trend reversals or geopolitical events don’t happen on a tidy schedule.
RSI or MACD won’t be able to tell you about military action in Europe, an oil shortage in the Middle East or changing trends in the U.S. presidential election. And if experts using Stephen King-length novels of data can’t make accurate predictions, how can we expect to have a 100% success rate in trading?
Technical analysis is practical, but it doesn’t have a perfect track record of predicting trend continuations or reversals. A careful investor using multiple indicators must be aware of false signals and use proper risk management tools to minimize losses. And while every investment involves some type of risk, momentum trading requires a different level of supervision since volatility can be unpredictable.
One of these risk management tools is the stop-loss order, which prevents a position from dropping below a certain level by automatically triggering a sell order. For example, if you buy 100 shares of GameStop Corp. (NYSE: GME) to ride a wave of upward momentum, you might want to set a stop loss order 10% below your entry price to prevent significant losses in a trend reversal.
If the share price continues to move upward, you can also increase your stop-loss order (or use a trailing stop order to automatically increase your exit point).
Conclusion
Momentum investing is a short-term trading strategy that rides strong trends. Traders using this technique utilize technical indicators like RSI and MACD to measure trend strengths and open positions in stocks with the most robust trend. Momentum trading is a popular strategy for institutional and retail investors but requires a strong stomach for risk and comprehensive knowledge of technical analysis.
Grow Your Portfolio with MarketBeat
Momentum investing can be a profitable short-term strategy, but it’s not for beginners just getting their feet wet in the markets. Want to learn more about momentum trading? MarketBeat has all the tools you’ll need to develop a plan and track your assets. Click here to learn more about our offerings.

One thing made a $3.4 million difference (same account size, same time period)
Dividend stocks are possibly the only investment where you have the opportunity for capital growth as well as income.
It's truly empowering once you see the impact that dividend stocks can make on any account size.
Imagine the peace of mind that could give you, knowing that your nest egg could be growing without having to make massive annual contributions.
Or slaving away at the computer screens trying to pick some miracle stock.

Financial Sector: Potential Trend Change Looms with Double Top
Previously an outperformer with a year-to-date gain of over 11%, the financial sector now finds itself at a critical juncture after giving back some of its gains. Just six trading days ago, the Financial Select Sector SPDR ETF (NYSE: XLF) made a new high but has since pulled back over 2%. From a technical analysis perspective, this recent action suggests the makings of a double top. This classic bearish pattern could signal a significant trend change and potential downside for the sector.
Currently trading near its uptrend support and at the critical juncture where the 20- and 50-day Simple Moving Averages (SMA) converge, the XLF is poised for a decisive move. If the ETF breaks below the key support zone at $41, it could confirm the trend shift and signal further downside. Despite this precarious position, the sector remains up nearly 10% year-to-date and boasts a remarkable 30% gain over the past year. To better understand the sector's future direction, examining its top holdings and their current standings is crucial.
Top Holdings in the Financial Sector ETF
The financial ETF provides exposure to significant players in the US financials segment, focusing on large banks through a cap-weighted, S&P 500-only portfolio while avoiding small-cap companies. Here’s a closer look at the ETF’s top three holdings:
Berkshire Hathaway Inc.
[content-module:CompanyOverview|NYSE:BRK.B]Berkshire Hathaway (NYSE: BRK.A, BRK.B), the ETF’s largest holding with a 12.99% weighting, has demonstrated robust performance, up over 14% year-to-date. The company (BRK.A) recently announced an impressive earnings beat, with quarterly earnings of $7,796.46 per share and revenue of $89.87 billion, reflecting its continued strength. Despite this, BRK.B has struggled to reclaim resistance at $420, consolidating instead above its rising 200-day SMA. In the near term, $400 will act as critical support. A break below this level could signal a potential downside for the stock and, by extension, the sector.
JPMorgan Chase & Co.
JPMorgan Chase (NYSE: JPM), the ETF’s second-largest holding, has also been an impressive mover, with its stock up 18% year-to-date. The company boasts an attractive P/E of 12.12 and a dividend yield of 2.29%, with analysts maintaining a moderate buy rating based on 13 ratings. From a technical analysis standpoint, JPM continues to make higher lows within its uptrend. The stock is well above its uptrend support of $190, and a bearish technical pattern would only take hold if it were to break below this key zone, which seems unlikely in the short term.
Visa Inc.
Visa (NYSE: V), the ETF’s third-largest holding with a 7.59% weighting, has underperformed relative to its peers, with the stock up just 5.4% year-to-date. Visa's P/E is more expensive at 31.17. The company recently reported strong earnings, with $2.51 EPS for the quarter, beating the consensus estimate by $0.08, and quarterly revenue of $8.78 billion, up 9.9% year-over-year. Despite these positive results, Visa recently made a lower high and is consolidating in the mid to low range of its consolidation on a higher timeframe. A break below its most recent higher low near $270 could signal a trend change and potential downside for the stock.
The Bottom Line
The financial sector stands at a potential inflection point, with the XLF displaying the makings of a double-top formation and trading near critical support levels. The recent pullback and tightening price action suggest a significant move may be imminent.
If the ETF breaks below the $41 critical support zone, it could confirm the trend shift and signal further downside. Investors should closely monitor the sector's top holdings—Berkshire Hathaway, JPMorgan Chase, and Visa—as their performance and technical patterns will likely play a pivotal role in determining the sector's overall direction in the coming weeks. Navigating these uncertain waters requires a careful and informed approach, balancing the sector's impressive year-to-date gains against the looming technical risks.
MarketBeat Media, LLC dba TickerReport
345 N Reid Place, Suite 620, Sioux Falls, SD 57103.
0 Response to "🌟 GameStop Will Rocket Higher: The Move Won’t Last "
Post a Comment