Eric’s risk/reward market framework… why it means he won’t buy today’s AI darlings… nosebleed market valuations… a check-in on our exit plan… Luke’s energy investment playbook VIEW IN BROWSER I don’t sit here today and go, “Nvidia’s a terrible stock.” It’s not a terrible stock. It’s been a great stock. It’s a great company run by great people… But other companies, in my opinion, offer vastly superior potential reward versus the risk than Nvidia does today. That comes from our macro investing expert, Eric Fry, of Fry’s Investment Report. Last week, he sat down with our Editor-in-Chief and fellow Digest writer, Luis Hernandez, for our Preferred Member Quarterly Call interview. While the chat covered a great deal of ground, let’s begin today with this topic of risk and reward to explain why Eric is hands-off on Nvidia, and what he recommends instead. Today, the broad market’s long-term setup offers plenty of risk – but how much reward? A few examples… The “Buffett Indicator” is Warren Buffett’s preferred macro indicator. It’s essentially the total value of U.S. publicly-traded stocks (or a broad market index) divided by the size of the U.S. economy (GDP). In his 2001 interview with Fortune, the Oracle of Omaha said: If the ratio approaches 200% – as it did in 1999 and a part of 2000 – you are playing with fire. So, where are we today? At the highest level ever recorded. According to BuffettIndicator.net, as of October 31, the number clocked in at 224.7%. Next, there’s the Cyclically-Adjusted Price-to-Earnings Ratio (CAPE or “Shiller P/E”). This is a variation of the P/E ratio that uses the 10-year average of inflation-adjusted earnings to smooth out booms & busts. As I write on Monday, it sits a hair under 41, whereas the long-term average is roughly in the mid-teens (about 17). The chart below shows that this is the second-highest level in more than 150 years of market data. 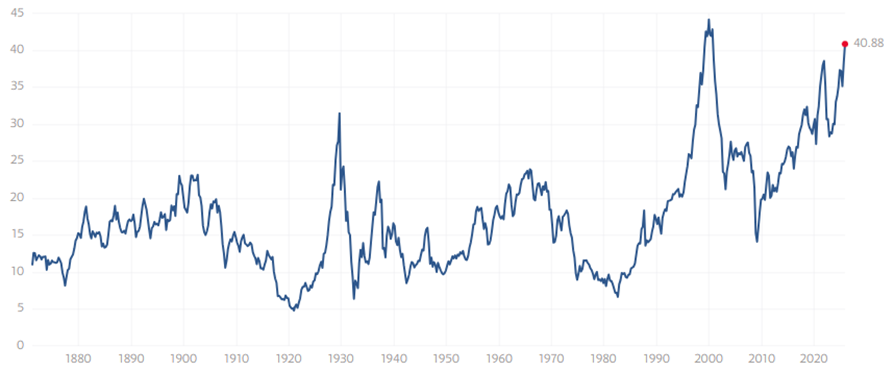
Source: Multpl.com Finally, there’s the Price-to-Sales Ratio (P/S) for the broad market. This compares the price of the market (or an index) to the total revenues of its companies. Sales tend to be more stable than earnings, which can swing for a variety of reasons. For the S&P 500, the P/S ratio is 3.376. In other words, investors are paying about $3.38 for every $1 of recent annual revenues. The historical median is about ~1.6X. So, we’re more than twice as expensive. Now, let’s be clear… This doesn’t mean a crash is imminent, or even certain. You can find valid reasons to explain away some of these lofty valuations. But it does mean each of us must be aware of the size of the potential risk that we’re accepting in exchange for the scope of the potential reward. | Recommended Link | | | | Nvidia gave investors a chance to make more than 150 times their money with its AI chips known as graphic processing units. Legendary investor Louis Navellier believes this new invention could be even more revolutionary and mint a new wave of millionaires. Click here to get the details. |  | | Eric’s reward/risk take on Nvidia As noted a moment ago, Eric believes Nvidia is a fantastic company and a dominant stock. But his investment criteria has him looking elsewhere. Here’s his full rationale: My whole process tries to zero in on asymmetric risks and rewards – opportunities that give you, let’s say, ten units of potential reward for every unit of risk you take. And to avoid the things that are the opposite. Lots of risk. Not much potential reward. So, I’m looking at opportunity in terms of “better than, worse than” … Maybe two years from now, Nvidia’s 50% higher than it is today. If it is, my assumption is that the stocks I’m recommending are going to be 60% higher. I don’t sit here today and go, “Nvidia’s a terrible stock.” But other companies, in my opinion, offer vastly superior potential reward versus the risk than Nvidia does today. To be clear, Eric isn’t picking on Nvidia. He’s cautious about many of the market’s AI darlings currently trading at nosebleed valuations – and he’s suggesting investors look elsewhere: A lot of people think you can’t make any money in [stocks that aren’t AI leaders today]. But the reality is, if things are going the way I think they will, that’s going to be about the only place you’re going to make any money over the next three years… If you’re going to buy [the AI darlings] at sky-high valuations, you’d better have a 30-year time horizon. We encourage you to set aside some time this week to review your portfolio holdings. Where are their valuations? Are you comfortable with them? Have you considered the potential hold period if the next three years bring the headwinds Eric references? I want to cover more ground in today’s Digest, but for a deeper dive here, Eric recently published a “Sell This, Buy That” research package that reveals the other AI darlings he’s recommending investors to sell today – and what to buy instead. From Eric: I’ve compiled a list of three companies that I believe are “Buys.” These are under-the-radar, early opportunities that can help you protect and multiply your money during make-or-break markets. You can find the details of these companies – ticker symbols and all – in my special broadcast, free of charge. But in the meantime, the AI market darlings are in charge You’re aware of this, but perhaps not to the full extent of it. From JPMorgan’s Michael Cembalest: I think this is well understood, but just to reinforce the point: AI-related stocks have accounted for 75% of S&P 500 returns, 80% of earnings growth and 90% of capital spending growth since ChatGPT launched in November 2022. Today, AI is the name of the game, period. And momentum is strong. Investors shouldn’t overlook or discount this reality – no matter today’s valuations. Fundamentals and valuations absolutely matter, but betting against a trend is like trying to swim against a fast-moving current. Many once-confident investors have gone broke waiting for the market to “make sense” under their cash flow models and valuation math. That’s why one of the principal ways we’re analyzing today’s market – and how long to remain a part of it – is through technical analysis that, in part, uses the 200-day moving average (MA). We outlined our plan in our October 13, 2025, Digest that featured senior analyst Brian Hunt’s “A, B, C” Framework. We encourage you to review it, but in short, it uses the S&P’s 200-day MA as a key indicator telling us when it’s time to get out of the way of a crashing bear. When the S&P’s price triggers a handful of milestones beneath the 200-day MA, it’s time to sell. We’re not trying to exit at the top, but rather, shortly after the top, before the worst of the bear arrives. As a quick check-in, as you can see below, we’re nowhere close to the 200-day MA today. 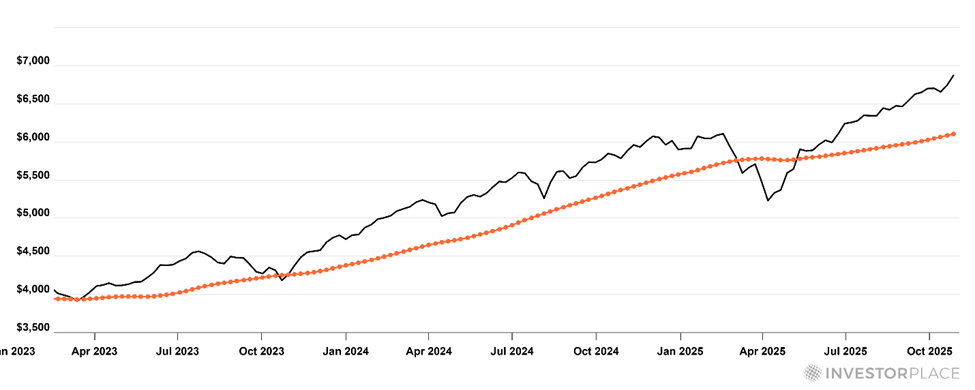
Now, this doesn’t mean the S&P couldn’t fall, say, 5% tomorrow, with some individual stocks pulling back double digits. Look again at the chart and you’ll see that today’s price is overextended relative to the 200-day MA. It would be normal – even healthy – for the S&P to pull back. But given that we’re nowhere close to the three triggers Brian identifies in his A, B, C System, we’re sticking with momentum. Bottom line: The bull is still charging – let’s not fight it. Finally, let’s end with stock ideas for trading this market To set the stage, let’s return to the JPMorgan piece from above: Data centers are eclipsing office construction spending and are coming under increased scrutiny for their impact on power grids and rising electricity prices. Specialized power rates for most data centers aren’t enough to cover costs of a new natural gas plant (leaving other customers to foot part of the bill), and in the PJM region, 70% of last year’s increased electricity cost was the result of data center demand. In Friday’s Digest, we covered AI’s insatiable appetite for energy due to this datacenter/AI infrastructure buildout with the help of our technology expert, Luke Lango. We stressed how, as AI becomes more powerful, it will demand even more electricity. According to Goldman Sachs, U.S. data center electricity demand is set to double by 2030, and that estimate may already be conservative. Meanwhile, the International Energy Agency has recently warned that the AI boom alone could consume as much power as an entire industrialized nation, such as Japan, within just a few years. So, how do we play this? Let’s return to Luke for some ideas: Deal flow is migrating to electrons: generation, grid, and backup… Morningstar pegs 2025–2030 U.S. grid capex at ~$1.4 trillion, which is more than double the prior decade. Here’s my three-layer framework: Utilities / IPPs Own the sellers of electricity AI will buy for years. Favorites include Constellation Energy (CEG) and Vistra (VST). Nuclear & Uranium Big reactors and SMRs are back. Buy Cameco (CCJ) for uranium; Global X Uranium ETF (URA) for basket exposure; Oklo (OKLO) and NuScale (SMR) as next-gen reactor names; Centrus Energy (LEU) and BWX Technologies (BWXT) as component suppliers. Energy Storage / Backup Data centers can’t go dark. Buy Bloom Energy (BE) for fuel cells; Fluence (FLNC) and Eos Energy (EOSE) for batteries. Storage also accelerates time-to-power: build the battery now, plug into the grid later. Capex cycles end, but if grid spend really doubles into 2030, we’re in the early innings. (Disclaimer: I own URA.) If you’d like to access all of Luke’s AI research, including his top AI recommendations, click here to learn about joining him in Innovation Investor. I will point out that Luke is watching today’s market with an awareness of what comes afterward… While he sees enormous opportunity today, Luke has warned his readers of what history suggests is on the other end of this boom tomorrow. He forecasts that we have another 12-18 months or so of a bull market. Perhaps longer, maybe shorter. No one knows exactly. This timing gray area – with “boom” on one end and “bust” on the other – brings us back to Eric’s spotlight on risk and reward. How much risk of the bust are you willing to accept for your estimation of what’s left in the boom? Here’s where Luke stands today: Bottom line: The AI bazooka is still firing. Stay in the blast radius … especially across power, nuclear, and storage … but keep one eye on credit and jobs, and the other on your 200-day. That’s how we stay in the game now. If we haven’t mapped out your own plan for “staying in the game,” we recommend you make that a priority. Have a good evening, Jeff Remsburg | 


0 Response to "Why Eric Fry Won’t Buy Nvidia"
Post a Comment