The Fed Is Triggering a Recession Signal By Larry Benedict, editor, Trading With Larry Benedict The Federal Reserve cut interest rates at its final meeting of 2025. It marks the third consecutive meeting where the Fed reduced the fed funds rate by 0.25%. Overall, the Fed cut rates by 0.75% for the year. That brings the total reduction to 1.75% since the easing cycle started back in September 2024. But in doing so, the central bank is helping lock in a reliable recession indicator. It’s a signal that triggered ahead of the last four recessions, including the Great Financial Crisis in 2008. Here’s what you need to watch… and why it warns of dark clouds gathering for the economy ahead. Watch the Yield Curve The Fed controls short-term interest rates with the fed funds rate. After inflation soared in 2021, the Fed began raising interest rates to the highest level in over 20 years. That pushed short-term interest rates above longer ones, which “inverted” the yield curve starting in 2022. Normally, longer-term rates are higher than shorter-term ones. After all, people who buy bonds need more compensation in exchange for locking up their money for a longer period. So it’s worth noting when that relationship flips on its head. The line in the chart below is the 10-year Treasury yield minus the 3-month Treasury yield for the past 10 years. 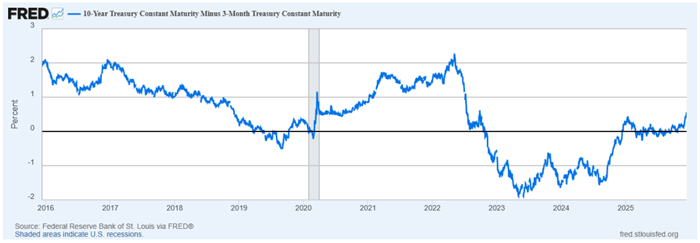
(Click here to expand image) When the blue line is below zero (the black line), that means the 3-month yield is higher than the 10-year… and the yield curve is inverted. Historically, that has been a good recession signal. It means the Fed has pushed interest rates too high, which stalls out the economy. But economists have been left scratching their heads this time around. This yield curve went inverted in October 2022, but there hasn’t been a recession. But the inversion itself isn’t the signal that should concern you. In the past, it’s when the yield curve uninverts that the recession countdown starts. And the Fed’s rate cuts are helping trigger that signal. Tune in to Trading With Larry Live 
Each week, Market Wizard Larry Benedict goes live to share his thoughts on what’s impacting the markets. Whether you’re a novice or expert trader, you won’t want to miss Larry’s insights and analysis. Even better, it’s free to watch. Simply visit us on YouTube at 8:30 a.m. ET, Monday through Thursday, to catch the latest. | The Real Recession Signal The 3-month Treasury yield is a short-term interest rate, so it tends to follow the Fed’s actions on interest rates very closely. Lately, the rate on 3-month Treasurys has been dropping as the Fed cuts rates. Here’s where the recession signal comes into play. The Fed usually only reduces rates at a quick pace when clear signs emerge that the economy is stalling. By then, the Fed is usually too late. Recall why the Fed is cutting this time around. Central bank officials are concerned about weakness in the labor market. After all, the unemployment rate has risen from 3.4% in April 2023 to 4.6% last month. That’s the highest level since September 2021. And job growth could be stalling out. Payrolls grew by 64,000 last month, but that follows a loss of 105,000 jobs in October. Since the Fed is late to act, falling rates often cause the yield curve to uninvert just before recession strikes. Here’s the difference between the 10-year and 3-month yield going back 40 years. The shaded areas represent recessions: You can see the blue line has moved back above zero just before each of the last four recessions. So when it comes to timing a recession, it isn’t the inverted yield curve you should worry about. It’s when it uninverts. And with the yield curve moving back above zero, historical precedent would suggest that a recession could be lurking around the corner. Regards, Larry Benedict
Editor, Trading With Larry Benedict Free Trading Resources Have you checked out Larry’s free trading resources on his website? It contains a full trading glossary to help kickstart your trading career – at zero cost to you. Just click here to check it out. | | 


0 Response to "The Fed Is Triggering a Recession Signal"
Post a Comment