This ad is sent on behalf of Banyan Hill Publishing. P.O. Box 8378, Delray Beach, FL 33482.
Today's editorial pick for you
How Traders Can Advantage UBER Stock Options' Fat Tail
Posted On Jan 08, 2026 by Joshua Enomoto
Invariably, most retail traders exploring the options market for Uber Technologies(NYSE:UBER) will have the same question: over a given period, where will UBER stock end up? It's the search for an answer that is at the center of the book, "The Physics of Wall Street," by James Owen Weatherall.
Table of Contents
Still, it's possible that investors could have been asking the wrong question. Consider the sport of football. Let's say that someone asked, “What is the probability that the next play is a passing play (as opposed to a run)?” There are actually two answers, and they're both legitimate.
Over the course of an NFL season, a team will choose to pass on average between 60% to 65% of the time. So on any given play, this range would be the "correct" answer. However, this stat is only true in the aggregate sense. From a tactical perspective, this knowledge really isn't that useful.
Indeed, the "real" answer — the useful answer — is that it depends on the situation. If it's late in the fourth quarter and the offense is behind, the next play is almost certainly going to be a pass. In other words, football strategy operates under the Markov property: the future state of a system depends only on its current state.
As it turns out, quantitative analysis is gaining popularity among options traders for utilizing this thought process to extract alpha.
What is Quantitative Analysis for the Financial Markets?
At the core, quantitative analysis is the study of past price behaviors to extract probabilistic insights, with the ultimate aim of securing a profitable trade. On the surface, the quant approach appears to be identical to technical analysis. However, the key difference is falsifiability. A quant assesses the market through a logic-based system in such a manner that other practitioners of the discipline can perfectly duplicate the calculated results.
With technical analysis, the old joke is that two market technicians can look at the same chart and deliver five different perspectives. While somewhat facetious, the meme points to a lack of falsifiability within the technical methodology. For example, when a security prints what appears to be a head-and-shoulders pattern, no official arbitration process exists to verify the validity of the signal.
Another critical issue is that technical analysis tends to be divorced from standard statistical methodologies. Even if we granted the legitimate existence of a head and shoulders in a particular price chart, the signal is almost always treated as a sample size of one. Quite damningly, the historical implication of the pattern is tied to other stocks flashing the head and shoulders, not the security at hand.
In effect, technical analysts are depending on chart patterns that apparently work in other stocks and juxtaposing those past analogs onto a different security. Under the quantitative methodology, such slippage does not occur. Unless otherwise specified, an empirical analysis is conducted strictly on the security in question.
Now, what makes quantitative analysis especially suitable for options trading is that the methodology deals with causality, whereas technical analysis largely focuses on correlation, especially correlation in motion (which is why so many technical indicators are based on moving averages). A quant looks for structural clues that may tip off where the next move may head.
In contrast, a technical analyst might look at the running back's pre-snap routine and infer what the next play might be. To be sure, some technicians might have a personal gift for reading the market. However, from an empirical perspective, the quantitative analyst observes the actual structure of the play, making the process much more consistent and reliable.
Extracting Nuanced Alpha from UBER Stock
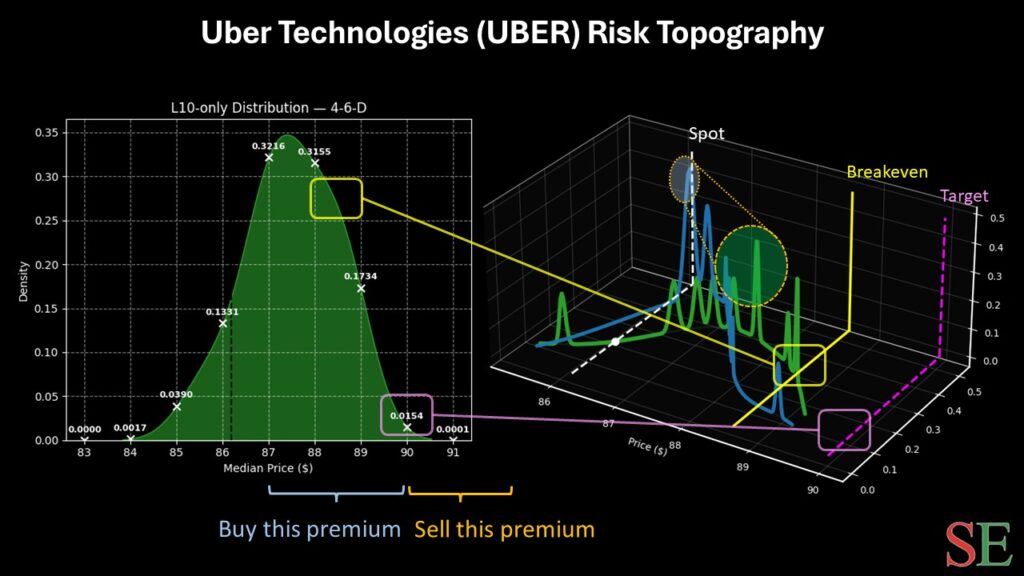
On any given 10-week period, UBER stock would likely land between $84.50 and $91 (assuming a spot price of $86.19, Wednesday's close). Across multiple trials, the probability density would likely peak around $86.50, indicating a modest upward bias, consistent with the natural behavioral tendency for UBER stock.
However, we're not interested in trading the aggregate behavior of UBER stock but rather the statistical response to the current quant signal. In the past 10 weeks, UBER stock printed only four up weeks, leading to an overall downward slope. Ordinarily, this setup would seem risky to outside observers, as it would appear that the bears are in control of the market.
Interestingly, when UBER stock is lined up in this 4-6-D (four up, six down, downward trend) sequence, the forward 10-week returns are little changed from the aggregate response, with outcomes likely to land between $84 and $91. But what does change is the rate of probability decay.
Between $87.50 to $91, the rate of decay under 4-6-D conditions is shallower or less concave than the decay seen in the probabilistic mass of baseline or aggregate behavior. Because of the gentler decay, traders responding to the 4-6-D sequence may be more aggressive with their options strategy than they otherwise normally would be.
With this dynamic in mind, aggressive speculators may consider the 87.50/90.00 bull call spread expiring Feb. 20, 2026. This wager involves two simultaneous transactions placed under one execution: buy the $87.50 call and sell the $90 call, for a net debit paid of $115. Should UBER stock rise through the second-leg strike ($90) at expiration, the maximum profit would be $135, a payout of over 117%.
Although an ambitious wager, the breakeven price for the above call spread comes in at $88.65, which is near peak probability density. Therefore, speculators may be able to balance risk exposure while still stretching for a solid payout.
Key Points to Consider for Quant-Driven Approaches
While the quantitative approach may offer unique insights (even advantages) for options traders, no methodology is perfect. Even by observing empirical price structures, a public security can materialize in unexpected ways.
That said, over enough trials, consistent patterns begin to emerge. Therefore, the quant-minded trader bets on these statistical pathways. They won't always be accurate but generally speaking, stocks tend to trade alongside probabilistically established routes. And in my opinion, this methodology beats guessing based on emotions and vibes.
This is a PAID ADVERTISEMENT provided to the subscribers of Daily Options Signals Free Newsletter. Although we have sent you this email, Daily Options Signals and StockEarnings does not specifically endorse this product nor is it responsible for the content of this advertisement. Furthermore, we make no guarantee or warranty about what is advertised above.
Your privacy is very important to us. If you no longer wish to receive email from DailyOptionsSignals.com, please click Unsubscribe.
StockEarnings, Inc 33 SE 4th St, Suite 100, Boca Raton, FL 33432 USA W: 877.6.STOCKS StockEarnings.com


0 Response to "I’ve Never Felt More Certain About January 19th"
Post a Comment