Volatility Looks Ready to Spike Higher By Larry Benedict, editor, Trading With Larry Benedict Stocks are struggling for traction. Since the start of the year, the S&P 500 has tested record highs near the 7,000 level repeatedly but has been rejected each time. The Nasdaq peaked back in October and remains well below its prior record. The action in many individual stocks is much worse. An ETF tracking the “Magnificent 7” just dropped into correction territory by trading 10% below its high late last year. While the action in the indexes feels bearish since the start of the year, it could just be the start of a larger pullback. Here’s what you need to watch over the next two weeks… Bearish Seasonals in Play You’ve probably heard about seasonal trends in the stock market. For example, “Sell in May and go away” is a popular Wall Street adage. Just as there are seasonal trends in the stock market, volatility follows similar patterns as well. The CBOE Volatility Index (VIX) is a popular tool for measuring price swings. It reports expected volatility in the S&P 500. Some call it Wall Street’s “fear gauge.” That’s because the VIX usually jumps higher when the S&P 500 pulls back. In other words, daily price movements pick up when the stock market is selling off. Conversely, the VIX tends to be the lowest when stock prices are steadily grinding higher. And just like the S&P has seasonal tendencies, the VIX has a history of spiking higher at certain times. Take a look at the chart below: 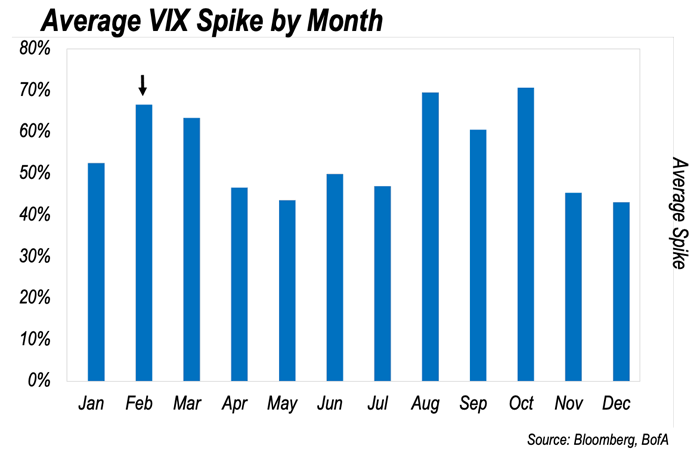
(Click here to expand image) When investor panic sets in, the VIX can move in a hurry. And historically, February averages the third-largest VIX spike compared to all other months (see the arrow). March’s spike history doesn’t slip by much. Plus, we’re now starting the worst two-week stretch of the entire year for the S&P 500. That’s based on historical return data going back to 1928. Compared to the last two weeks of February, no other two-week period has been worse, historically. Remember, VIX tends to jump when the S&P 500 is selling off. With those seasonal trends in mind, you need to keep a close eye on this VIX chart… Tune in to Trading With Larry Live 
Each week, Market Wizard Larry Benedict goes live to share his thoughts on what’s impacting the markets. Whether you’re a novice or expert trader, you won’t want to miss Larry’s insights and analysis. Even better, it’s free to watch. Simply visit us on YouTube at 8:30 a.m. ET, Monday through Thursday, to catch the latest. | VIX Set to Jump? The VIX has done something interesting since the end of 2025. It closed at 13.5 on Christmas Eve. Since then, the VIX has been making a steady series of higher lows. Here’s the chart: 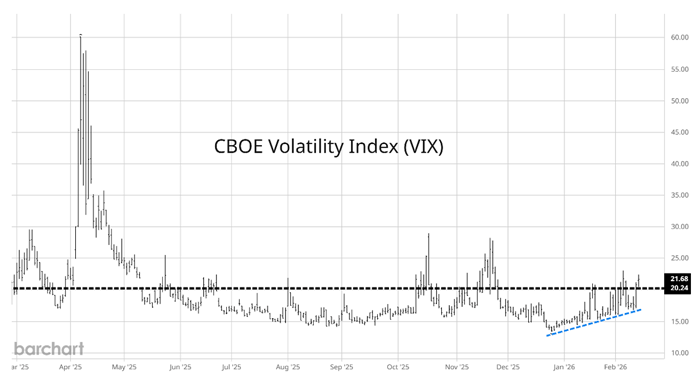
(Click here to expand image) The blue upward-sloping line shows the steady move higher in the VIX throughout this year. The VIX has pulled back each time it gets near the 20 level (horizontal black dashed line). That’s a notable level to monitor because 20 is the long-term average for the VIX. But the pullbacks are getting smaller each time, as the VIX makes higher lows. We should now be on the lookout for a sustained break above the 20 level, which is often associated with a quick sell-off in the S&P 500. Given the recent downward pressure we’re already seeing in many Mag 7 stocks, don’t be surprised by a broader jump in volatility in the weeks ahead… Happy Trading, Larry Benedict
Editor, Trading With Larry Benedict P.S. There’s very little time left to catch the replay of my Wall Street Money Calls event. I don’t want you to let this earnings season slip away without taking full advantage of the trading opportunities I see. My trading strategy can help you put thousands of dollars into your account each quarter. If you haven’t yet learned about the eight signals that I pay close attention to on every earnings call, then go here now to watch. Free Trading Resources Have you checked out Larry’s free trading resources on his website? It contains a full trading glossary to help kickstart your trading career – at zero cost to you. Just click here to check it out. | | 


0 Response to "Volatility Looks Ready to Spike Higher"
Post a Comment