| December 17th, 2021 Buying Pressure Pushes VNQ Upward Dear Reader, Yesterday, we looked at a Monthly Price Chart of Rexford Industrial Realty, Inc., noting the stock’s 1-Month Price is trading above the 10-Month SMA signaling a ‘Buy’. For today’s Trade of the Day we will be looking at an On Balance Volume chart the Vanguard Real Estate ETF, symbol: VNQ. Before breaking down VNQ’s OBV chart let’s first review the investment objective of the ETF. The VNQ ETF seeks to provide a high level of income and moderate long-term capital appreciation by tracking the performance of the MSCI US Investable Market Real Estate 25/50 Index that measures the performance of publicly traded equity REITs and other real estate-related investments. Confirming a Price Uptrend with OBV The VNQ daily price chart below shows that VNQ is in a price uptrend as the current price is above the price VNQ traded at five months ago (circled). The On Balance Volume chart is below the daily chart. On Balance Volume measures volume flow with a single Easy-to-Read Line. Volume flow precedes price movement and helps sustain the price uptrend. When an ETF closes up, volume is added to the line. When an ETF closes down, volume is subtracted from the line. A cumulative total of these additions and subtractions form the OBV line. On Balance Volume Indicator ● When Close is Up, Volume is Added ● When Close is Down, Volume is Subtracted ● A Cumulative Total of Additions and Subtractions form the OBV Line Volume flow precedes price and is the key to measuring the validity and sustainability of a price trend. We can see from the OBV chart below that the On Balance Volume line for VNQ is sloping up. An up-sloping line indicates that the volume is heavier on up days and buying pressure is exceeding selling pressure. Buying pressure must continue to exceed selling pressure in order to sustain a price uptrend. So, On Balance Volume is a simple indicator to use that confirms the price uptrend and its sustainability. The numerical value of the On Balance Volume line is not important. We simply want to see an up-sloping line to confirm a price up trend. 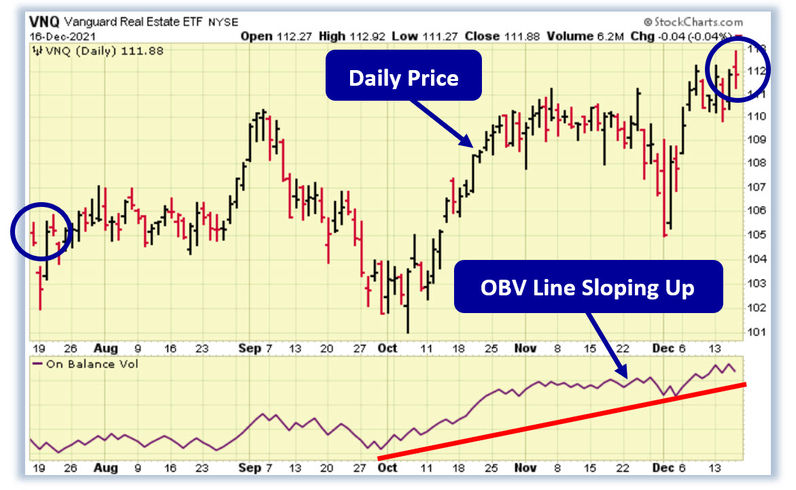
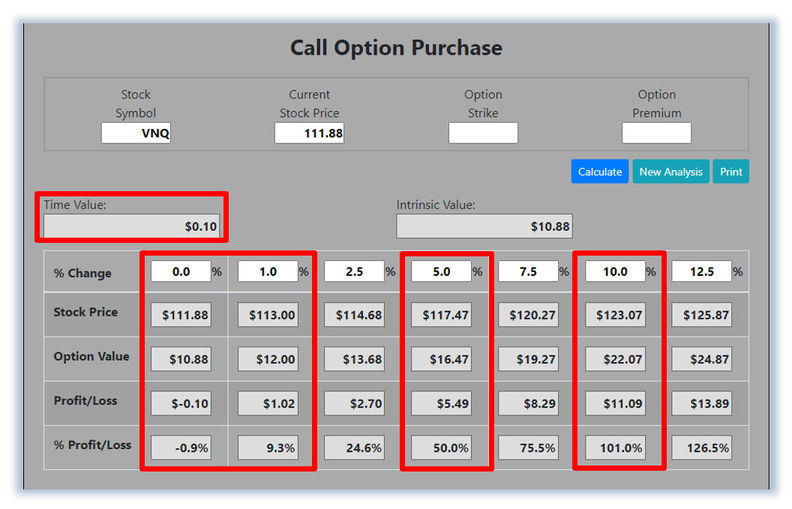
Confirmed ‘Buy’ Signal for VNQ Since VNQ's OBV line is sloping up, the most likely future price movement for VNQ is up, making VNQ a good candidate for an ETF purchase or a call option purchase. Let's use the Hughes Optioneering calculator to look at the potential returns for a VNQ call option purchase. The Call Option Calculator will calculate the profit/loss potential for a call option trade based on the price change of the underlying stock/ETF at option expiration in this example from a flat VNQ price to a 12.5% increase. The Optioneering Team uses the 1% Rule to select an option strike price with a higher percentage of winning trades. In the following VNQ option example, we used the 1% Rule to select the VNQ option strike price but out of fairness to our paid option service subscribers we don’t list the strike price used in the profit/loss calculation. | 


0 Response to "Buying Pressure Pushes VNQ Upward"
Post a Comment