| December 10th, 2021 Profit if AOSL is Up, Flat, or Down Dear Reader, Yesterday, we looked at a Daily Price Chart of Tractor Supply Co. noting the stock has been making a series of higher highs and higher lows since mid-October. For today’s Trade of the Day we will be looking at a Keltner Channel chart for Alpha and Omega Semiconductor Ltd. stock symbol: AOSL. Before breaking down AOSL’s daily Keltner Channel chart let’s first review which products and services are offered by the company. Alpha and Omega Semiconductor Limited designs, develops, and supplies power semiconductor products for computing, consumer electronics, communication, and industrial applications in Hong Kong, China, South Korea, the United States, and internationally. It offers power discrete products, including metal-oxide-semiconductor field-effect transistors, SRFETs, XSFET, electrostatic discharge, protected MOSFETs, high and mid-voltage MOSFETs, and insulated gate bipolar transistors for use in smart phone chargers, battery packs, notebooks, desktop and servers, data centers, base stations, graphics card, game boxes, TVs, AC adapters, power supplies, motor control, power tools, e-vehicles, and more. Now, let’s begin to break down the Keltner Channel chart for AOSL. Below is a Daily Price Chart and the three Keltner Channels for AOSL stock. 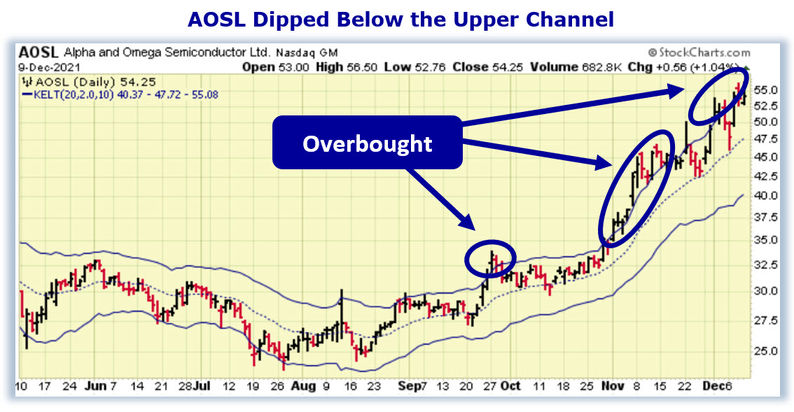
Buy AOSL Stock The Hughes Optioneering Team uses the Keltner Channels as an indicator to determine whether a stock is overbought or oversold. If a stock’s daily stock price is trading above the upper Keltner Channel, this signals that the stock is temporarily overbought and subject to a retracement. Even stocks that are in the strongest bull trends do not advance in a straight line. There are always price retracements along the way. When a stock becomes overbought, it’s price will typically decline soon after as the inevitable profit taking occurs. The AOSL daily price chart shows that the stock is in a strong price uptrend and has become overbought several times. You can see this as AOSL has traded above the Upper Keltner Channel on multiple occasions recently. But, in every scenario when AOSL became overbought, the stock soon experienced a pullback. Finding opportunities when a stock experiences a pullback is why the Hughes Optioneering Team uses the Keltner Channels. They help us find a lower-risk entry point. The Keltner Channel “Buy Zone” occurs when a stock is trading below the upper Keltner Channel. Once the daily price is trading below the upper channel, it provides a lower-risk buying opportunity as the stock is likely to rally. Our initial price target for AOSL stock is 60.00 per share. | 


0 Response to "Profit if AOSL is Up, Flat, or Down"
Post a Comment