Ticker Reports for October 28th
Inflation Risk Rising, Key Trades Investors Are Making Now
Everyone, especially the Federal Reserve (the Fed), thought that inflation was a thing of the past and that it had now been tamed enough to consider a sudden shift in monetary policy. However, this is far from reality, especially when investors consider the way some of the inflation—and interest rate-sensitive asset classes have behaved lately.
As Paul Tudor Jones correctly stated in an interview recently, all roads now lead to inflation in the United States. This is mainly caused by the overall national debt and its interest payments, which make up a significant amount of the nation’s finances today. So, according to his view, the only way to dig the economy out of this is to inflate, which is why investors need to be more aware of this trade today than ever.
With the price action in small-cap stocks measured through the iShares Russell 2000 ETF (NYSEARCA: IWM) against the iShares 20+ Year Treasury Bond ETF (NASDAQ: TLT), investors can see how the broader market is beginning to price in the potential for higher inflation in the coming quarters. More than that, the recent trades being made in the ARK Innovation ETF (NYSEARCA: ARKK) and the SPDR Gold Shares (NYSEARCA: GLD) can further confirm this trend gaining momentum.
Price Action Shift Highlights a Key Divergence Investors Can't Ignore
For the first half of 2024, the small-cap and bond ETFs tracked each other, which is expected in an economic recovery environment or the so-called “soft landing” markets were hoping for. However, these two asset classes have diverged as of the past quarter.
The small-cap ETF has remained near its highs. At the same time, the bond ETF has significantly retraced from highs, which is typical behavior of a rising inflation environment. This is the first check investors should consider in this potential inflation run. More than that, the price of overseas equities also shows the outlook favoring a rise in inflation for the United States.
Since inflation is bad for the dollar, and most overseas stocks are quoted in dollars, what is bad for the currency is good for these stocks and their prices. This is one reason Chinese stocks went on an absolute tear over the past month, where the iShares MSCI China ETF (NYSEARCA: MCHI) rallied by as much as 20.9% during the past quarter alone.
Now that the small-cap ETF approaches a significant resistance level, it would be critical to watch out for a breakout of this ceiling to get either a confirmation or denial of the inflation trade for the coming months.
At the same time, investors need to watch for a potential bottoming in the bond ETF as well. If further bearish price action follows, along with a failure for small caps to break out, it would confirm that the inflation trade is back on for most market participants.
Inflation Risks Rise: Recent Trades Signal Growing Market Concerns
Inflation risks will help value stocks and potentially hurt growth stocks, as investors prefer quality over uncertainty, which a currency's underlying depreciation will eat away. With this in mind, investors can reference the ARK Innovation ETF.
Throughout October 2024, several institutional sellers have decreased their exposure to this ETF, an action that can be taken as a potential hedge against upcoming inflation. More than that, relative price action between the iShares S&P 500 Value ETF (NYSEARCA: IVE) and the iShares S&P 500 Growth ETF (NYSEARCA: IVW) also shows signs of a coming rotation out of growth and into value or quality.
When it comes to the iShares S&P 500 Growth ETF, many unusual put options (which benefit from a stock's decline) have been spotted on the put side. These traders bought up to 21,000 contracts in a bet that the small-cap ETF would reach $180 a share by the end of October 2024, calling for a selloff as big as 18% from where it trades today.
That is one way to interpret an inflation trade, but there's another. Recently, the SPDR Gold Shares ETF has seen a new breakout in call options, which, as opposed to put options, benefit from a stock rally. Traders are now betting that the price could also reach $266 by the end of the month.
With Warren Buffett also betting on the energy sector breaking out, as he recently bought up to 29% of Occidental Petroleum Co. (NYSE: OXY), all roads seem to lead to an inflation trade coming up. That's not just a saying; it's a direct quote from Paul Tudor Jones in a recent CNBC interview, where he recommended buying commodities this quarter.

Tim Sykes' Urgent Trade Alert: "Make this move now"
WARNING: 80 Wall Street banks are gearing up for MASSIVE D.C. shock
This $2 trillion D.C. shock is NOT about Trump or Biden dropping out of the race…

3 Oil Stocks to Watch Before Earnings Come Out
Earnings season can be a volatile period for stock ownership due to the uncertainty surrounding whether the underlying companies' results will beat or disappoint. However, there are ways for investors to gauge the trends behind certain companies, landing them on the bullish or bearish side of earnings expectations.
Making for potential opportunities, specific trends in the energy sector could make three oil stocks worth watching before, during, and after their earnings are announced this week. With some of these fundamental trends setting these companies up for a potentially bullish outcome, unexpected earnings beats may be on the horizon for them to set a longer-term uptrend.
These stocks include names like Exxon Mobil Co. (NYSE: XOM) to represent the bottom of the value chain in oil, with international integrated operations that see the benefit of bullish energy trends last. Then, there’s Hess Co. (NYSE: HES) in the middle of the chain, which gives investors a relatively quicker return with little added risk. For those looking into a high-risk and high-reward setup, shares of Transocean Ltd. (NYSE: RIG) can be considered at the top of the value chain.
Trends to Watch Out for in Oil Markets
Most commodities are driven by supply and demand, but that’s only half of the equation, mainly the academic equation. In real-world terms, the component of outlooks and sentiment play an even bigger role in the price of oil today, so setting expectations for the future might be the best place to start after supply and demand are gauged.
Supply has been a downtrend for the past quarter despite recent spikes in the United States' national oil stock level. Despite marginally lower supply, prices have yet to break above $80 a barrel comfortably, so this has to be a potential demand issue.
Bingo, the manufacturing PMI index for the U.S., has been on a 23-month consecutive contraction to severely compress oil demand for one of the world’s biggest economies. Then there’s China, which represents a significant share of global oil demand, whose economy has yet to come back online despite recent rounds of stimulus. These are the two demand gaps working against oil prices.
However, two of Wall Street’s best have recently appeared on Bloomberg and CNBC to express their views on higher inflation in the following months. These two are Stanley Druckenmiller and Paul Tudor Jones. So, even though demand is not here yet, expectations are definitely starting to trickle in favor of oil prices.
Exxon Mobil Stock: The Safer Route for Oil Demand
Due to its international presence, this $456.7 billion company has the advantage of stability and independence from operating in one single economy. However, this safety comes at the cost of lower growth potential, which is why investors at Scotiabank only see a $145 price target today, calling for a 21.3% upside from where the stock trades today.
More than that, Wall Street analysts only project up to $2.25 earnings per share (EPS) for the next 12 months, which is only a 5% growth from today’s $2.14 earnings. This is the stability factor that investors will get through a 0.88 beta, with the only caveat that slower growth will be had and, therefore, a lower potential upside.
Nonetheless, the stock has been performing well ahead of a potential oil price increase, with some institutional buyers also coming in. Those at Adams Natural Resources Fund recently added 0.8% to their Exxon Mobil holdings, netting their investment to $174.6 million today.
More Upside in Hess Stock: Reward Comes with Added Risk
Hess stock’s beta is higher than Exxon’s at 1.16 for added risk, but with added risk comes higher reward potential. This smaller $41.2 billion company is more concentrated in the United States oil market, giving it a much higher upside potential when the manufacturing sector returns.
This is why analysts at the UBS Group see a price target as high as $173 for Hess stock today, calling for an upside potential of as much as 25.4% from where the stock sits today. Knowing that the stock has plenty of upside potential, markets are paying a premium for Hess above the rest of the sector today.
A price-to-earnings (P/E) ratio of 16x commands a premium above the energy sector’s average valuation of 11.2x today, showing a willingness to overpay for this stock ahead of earnings.
Double-Digit Upside Potential for Risk-Takers in Transocean Stock
In volatility terms, Transocean stock carries a much higher beta of 2.8, making it a high-risk profile trade for investors to consider. However, as is the case with risky trades, the upside is also justifiable in this stock at the top of the value chain.
Transocean leases rig equipment to big oil names and the rate of lease contracts depends on the oil price. This means that Transocean is one of the first to get paid as soon as oil prices go up, which is why there’s so much Wall Street interest surrounding this stock.
Analysts at Susquehanna think that Transocean could reach a high of $7 a share, which calls for up to 69% upside from where it trades today. This is alongside the 6.3% reduction in the company’s short interest over the past month alone. Analysts also back up this upside through their EPS projections for the next 12 months.
Flipping from a net loss today to a net gain per share of $0.12 a share by next year gives Transocean enough growth potential to justify the risks investors take in this stock ahead of earnings.

How to Legally Opt-Out of the Central Bank Digital Currency
Biden and the democrats are rushing to roll out the new digital dollar system before the election in 2024
This could be your last chance to protect your cash from a central bank digital currency.
This new rule will give the government COMPLETE CONTROL over your money.

Is American Express Stock's Sell-the-News Reaction a Buying Opp?
Global financial services provider American Express Inc. (NYSE: AXP) reported solid results for its third quarter of 2024 that were met with a sell-the-news reaction. While the company did beat and raise guidance, some soft spots shook investors. The bar was set high heading into earnings, with its stock trading up over 50% year-to-date (YTD) near all-time highs. Any semblance of softness was bound to trigger profit-taking. However, bullish investors may find this pullback as a buying opportunity.
The financial services sector giant was reporting after rival credit card services provider Discovery Financial Services (NYSE: DFS), which is merging with Capital One Financial Co. (NYSE: COF), reported blowout results.
A Well-Oiled Machine With a Few Kinks
American Express grew its earnings-per-share (EPS) by 6% YoY to $3.49, beating consensus estimates by 20 cents. It grew its billed business by 6% YoY to $387.3 billion, which is the total amount of transactions made in the quarter. Revenues rose 8.2% YoY to $16.64 billion, which actually fell short of the $16.68 billion that analysts were expecting. Its consolidated provisions for credit losses rose to $1.4 billion, up from $1.2 billion in the year-ago period, due to higher net write-offs as loan balances credit.
The net write-off rate was slightly higher at 1.9% versus 1.8% last year. However, it did drop sequentially from 2.1% in the prior quarter. On a positive note, the number of transactions rose 9% YoY as cardmembers are engaging more with their Amex cards. The company closed the quarter with 447.9 billion in cash and cash equivalents, which was a $1.3 billion improvement from last year.
Quality and Quantity
American Express saw card fee revenue growth was 18% YoY as card member spending grew 6%. The company attracted 3.3 million new premium card members while maintaining high retention rates and excellent credit performance. Traditionally, American Express was known for users paying off their full charge card balances monthly, but now they have flexible credit card payment plans and allow for minimum payments that accrue interest like Visa Inc. (NYSE: V) and Mastercard Inc. (NYSE: MA) credit cards.
American Express cards tend to have higher credit score requirements, especially for its premium cards, along with higher annual fees, which can range from $25 for its entry-level Green card up to $695 for its Platinum card. Its Centurion card is rumored to have a $10,000 initial fee and $5,000 annual fee with no spending limit.
Millennials and Gen-Z Are Fastest Growing Consumer Segment
American Express pointed out that the recent launch of its U.S. Consumer Gold Card with added benefits in its dining category is fueling growth with its Millennial and Gen-Z customers, helping to grow U.S. spending by 12% YoY in the quarter. This demographic represents 80% of new accounts acquired on the U.S. Consumer Gold Card. New customer retention rates are also higher than that of older generations.
The beauty of this demographic is that the company expects them to grow into higher premium cards (IE, green to fold to platinum) over time. American Express is not only an iconic affluent brand but also a functional status symbol with its iconic Gold, Platinum and Centurion (Black) American Express Cards flaunted by celebrities and social media influencers.
American Express Issues Upside Guidance
The company provided full-year 2024 upside guidance as it expected EPS between $13.75 and $14.05, which was raised from its previous guidance range of $13.30 to $13.80 versus $13.62 consensus estimates. Revenue growth is still expected at around 9%. However, this was the lower part of the 9% to 11% range it expected at the beginning of the year. This was also seen as a soft sign that spooked investors.
Softness in Travel and Entertainment and Airline Segments
American Express cardholders have shown some cautiousness in their YoY spending in the travel and entertainment segment’s airline category, which saw billed business growth of 6%, down from 13% last year. However, dining is its fastest-growing travel and entertainment category, rising 7% YoY and growing at nearly twice the overall industry rate.
AXP Stock is in an Ascending Channel
An ascending channel is comprised of parallel ascending upper trendline resistance and lower trendline supports. A breakdown occurs if the stock falls under the lower trendline.
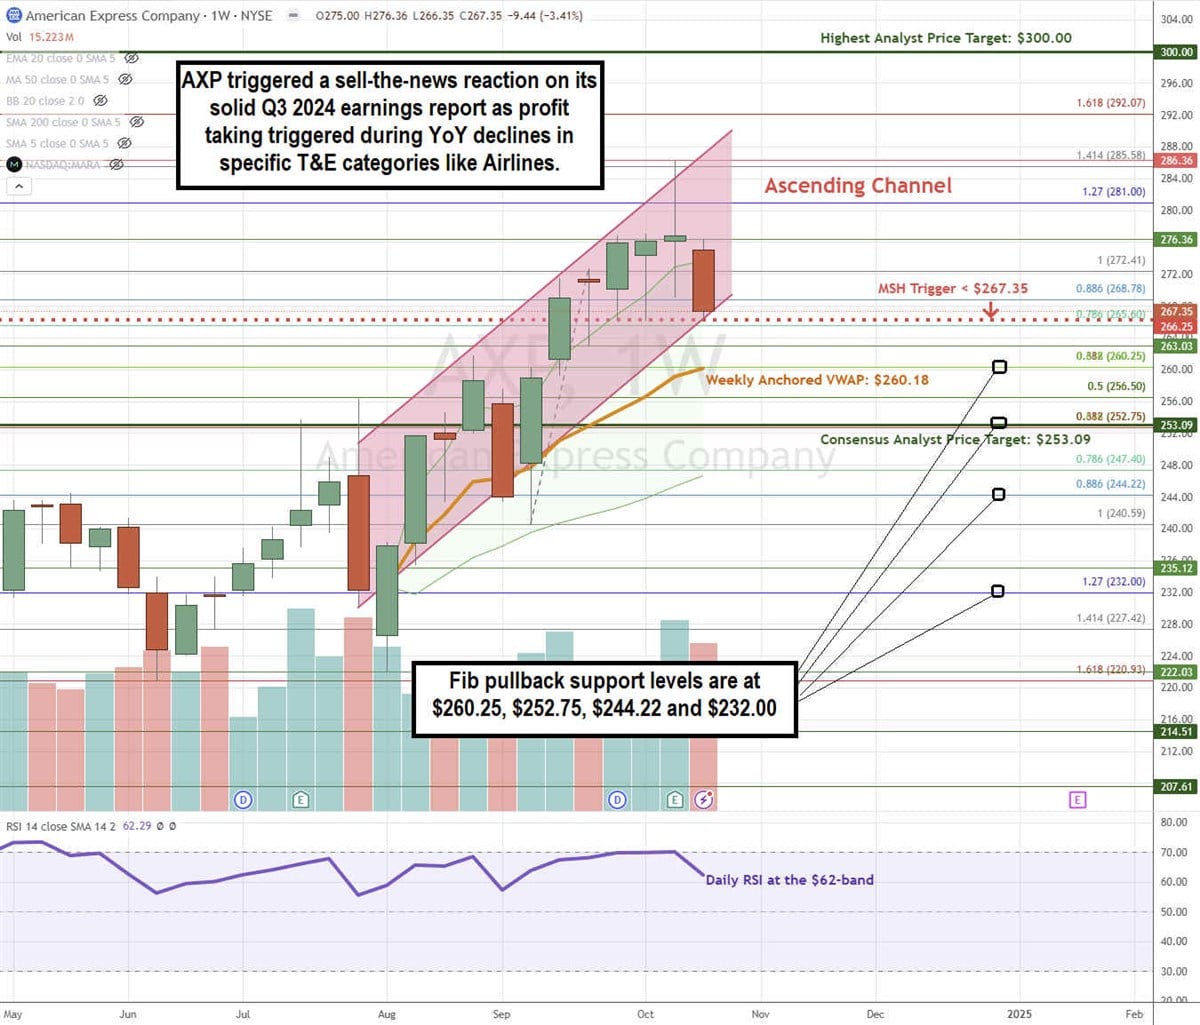
AXP has been in an ascending triangle uptrend since its $222.03 swing low. It made higher highs six days preceding earnings to set up a market structure high (MSH) sell trigger under $266.25. An MSH trigger is a three-candle formation comprised of a high, higher high and lower high candle.
The lowest point of the lower high candle market is the sell trigger, which also happens to overlap the lower trendline. The daily anchored VWAP support is at $160.18. The daily RSI is falling to the 62-band. There is more downside to watch for if the MSH triggers as the stock falls under $266.25. Fibonacci (Fib) pullback support levels are at $260.25, %252.74, $244.22 and $232.00.
American Express’s average consensus price target is $253.09 indicating a 5.3% downside, and its highest analyst price target sits at $300.00. It has 8 analysts' Buy ratings, 13 Hold ratings and 4 Sell ratings. The stock trades at 20.35X forward earnings.
Actionable Options Strategies: Bullish investors can consider using cash-secured puts at the Fib pullback support levels to buy the dip. If assigned the shares, then writing covered call at upside Fib levels executes a wheel strategy for income in addition to the 1.05% annual dividend yield.
MarketBeat Media, LLC dba TickerReport
345 N Reid Place, Suite 620, Sioux Falls, SD 57103.
0 Response to "🌟 3 Oil Stocks to Watch Before Earnings Come Out"
Post a Comment