How You Can Profit During the Worst Month of the Year VIEW IN BROWSER I have a confession to make… I hate the month of August. It doesn't have anything to do with the weather, although the heat can be pretty sweltering at my homes in Nevada and Florida. No, my gripe with August has to do with the stock market. See, August is when much of Wall Street goes on vacation. Europe practically shuts down. This means the “B team” is left in charge. And that’s where things can get dicey. Trading volume dries up, and stocks become more vulnerable to manipulation by unscrupulous short sellers and hedge funds. Case in point: The flash crash of 2015. On the morning of August 24, the Dow fell more than 1,000 points within minutes. Hundreds of stocks failed to open normally. Exchange-traded funds (ETFs) like iShares Select Dividend (DVY) and Vanguard Dividend Appreciation (VIG) dropped more than 30% intraday – even though their underlying holdings hadn’t fallen anywhere near that much. The result was pure chaos. Stop-loss orders were triggered. Circuit breakers kicked in. And regular investors got crushed by pricing errors they never saw coming. Now, granted, this is an extreme example. But instances like this are the reason why I’ve joked for years that if I were in charge of the stock market, I would close it in August and let everyone stay on vacation. So, in today’s Market 360, I’d like to explain exactly why August has such a bad reputation (and rightfully so). While I do expect the market to experience its fair share of volatility and short seller shenanigans this August, there is one stock that should buck the broader market trend, as evidenced by a powerful “buy” signal that’s backed by rigorous data from one of the most powerful seasonal tools I’ve seen in nearly five decades on Wall Street. (Hint: The pick in question also happens to be one of my absolute favorite stocks.) I’ll also reveal how you can learn more about this seasonality tool and how to use it yourself. Let’s get started. Why August Is a Bad Month for Stocks Over the last 15 years, the S&P 500 has finished August higher just 50% of the time. That’s a coin flip, folks. The chart below makes it hard to argue with. 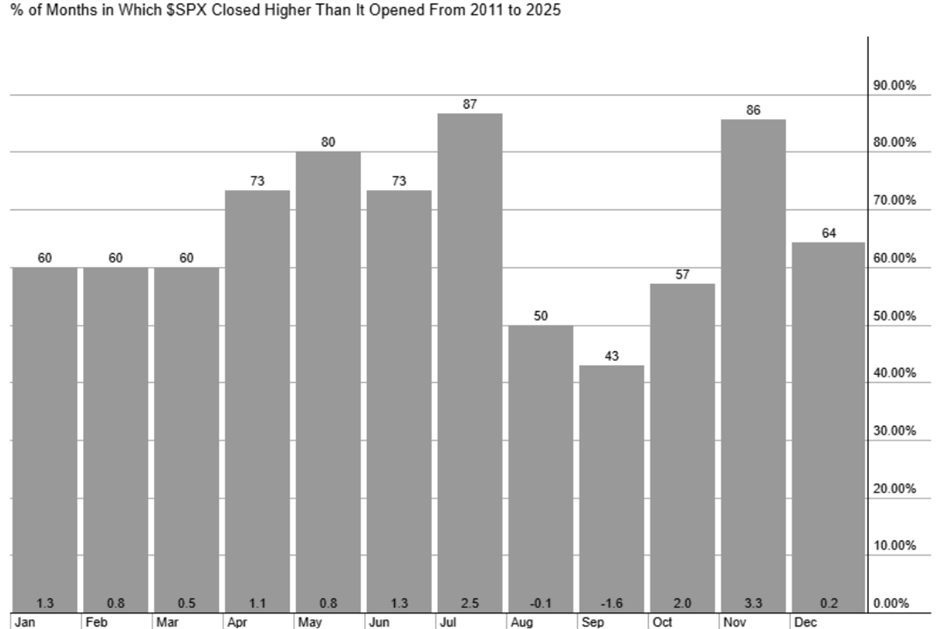 August is one of the weakest months for the S&P 500 over the past 15 years (Source: StockCharts)
The average return in August is slightly negative, around -0.1%. Contrast that with July, which has seen gains in 87% of years, or November, which clocks in at 86%. Both deliver average gains between 2.5% and 3.3%. Now, to be fair, election years like 2024 can break the pattern. In presidential election years, August often flips from laggard to leader. Historically, the S&P 500 has averaged a 1.3% gain in August during those cycles, with tech and small-cap stocks showing the most strength. Still, a tailwind only matters if you know where to focus. That’s where a powerful new tool from my longtime colleague Keith Kaplan comes in. | Recommended Link | | | | UAE committed $1.4 trillion, Saudi Arabia $600 billion, Japan $1 trillion. Louis Navellier says it's all connected to Trump's "economic wall" — a systematic plan to rebuild American manufacturing. He's identified the companies that could explode from this trend. Click here to see which stocks made his list. |  | | Investing In the "Green Days" Keith is the CEO of TradeSmith, our corporate partner. And his team has developed a system that tracks seasonality across 5,000 stocks. It shows exactly when each stock is historically most likely to make a big move. In fact, it’s already uncovered rapid gains like 247% on Intuit Inc. (INTU), 180% on Analog Devices, Inc. (ADI) and 124% on Booking Holdings Inc. (BKNG). Many of those played out in 15 days or less. The idea is simple. Certain stocks have what Keith calls “green days.” These are recurring calendar windows when a stock has a strong, consistent track record of rising, no matter what the rest of the market is doing. I bring this up because I recently got the chance to look under the hood at this new tool. Now, if you’ve followed my work, you know I am more of a “buy and hold” guy. I prefer holding strong companies for years, not weeks. But having said that, I am also a self-professed “numbers guy”. I built my first quantitative model in the 1970s. I’ve often been called one of the first “quants” on Wall Street. So, after looking under the hood, even I have to admit that it’s unlike anything I’ve encountered in my 50-year career. For example, when Keith’s team ran the numbers for the S&P 500 itself, the results lined up perfectly with what I’ve been saying about August for years. What you see in the chart below are the “green days” for the S&P 500 over the past 15 years. After some broad, powerful green zones in the spring, things peter out a bit in May before picking right back up in June and July. 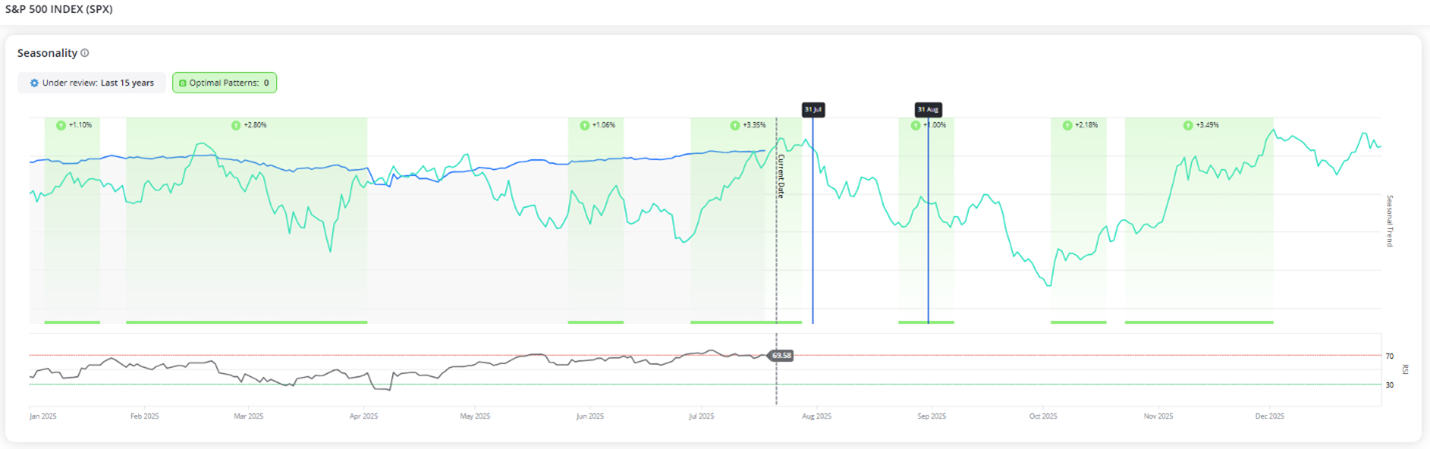 But after that? Things really slow down until roughly the last week of August. For the past 15 years, in August, the index showed: - A 53.33% win rate
- An average return of -0.36%
- A median return near zero at 0.005%
- And an annualized return of -4.13%
In other words, the S&P doesn’t just tread water in August. It slowly sinks. One Stock I Would Trade in August Now, having said that, if I were a trader, there is one stock I would feel confident about right now. That’s because, not only is it one of my absolute favorite stocks, this tool is telling me it’s a screaming buy. I’m talking about NVIDIA Corporation (NVDA). The seasonality data shows: - An 80% win rate during August
- An average return of 5.84%
- A median return of 4.36%
- And an annualized return of 95.11%
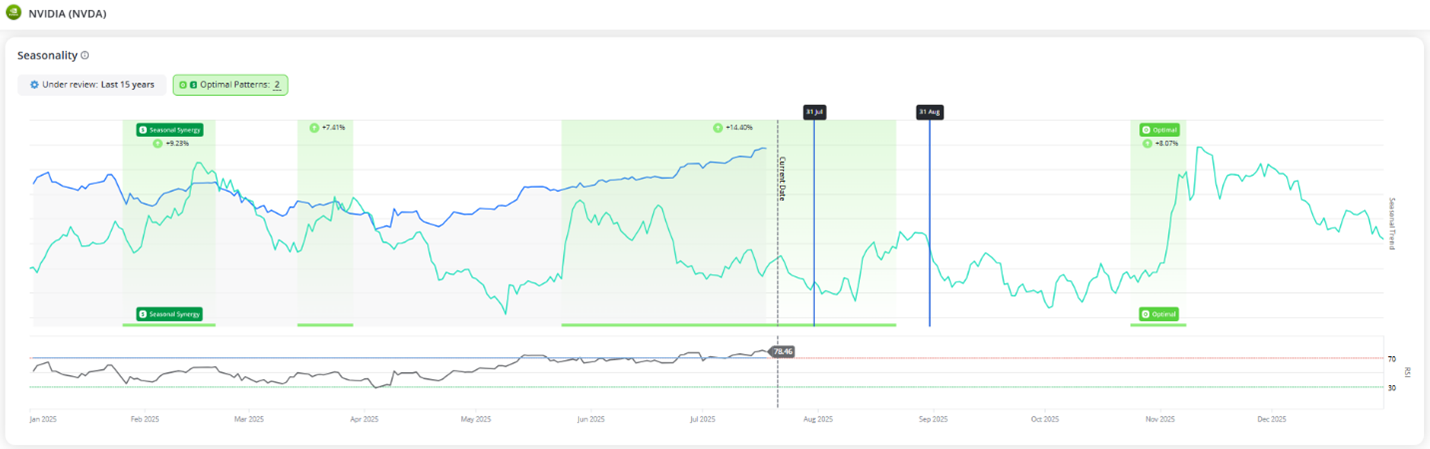 This fits with what we already know about the company. NVIDIA is leading the AI Revolution. Its fundamentals are strong, as it’s one of the few mega-cap names still showing real earnings momentum. So, if I were going to put on one trade in August, it would be NVIDIA – no question. How to Get Your Hands on This Tool Now, as powerful as NVIDIA’s green days look, it isn’t the only one. Keith’s system is pointing to a broader shift that begins this week. It has already identified several high-probability trades. And tomorrow, at 10 a.m. Eastern, he’ll show you how to spot them, how to act on them – and how to potentially do it without long-term risk exposure. I urge you to join Keith for his special briefing tomorrow to walk you through what his system is flashing now and what comes next. You’ll even get a few stock ideas just for attending. Click here to reserve your spot for tomorrow’s free event. If you’ve ever wondered when to trade, not just what to trade, this is the most important market briefing you’ll see all summer. I hope to see you there. Sincerely, | .png)
.png)


0 Response to "Must Read: How You Can Profit During the Worst Month of the Year"
Post a Comment