What history says when gold has rallied this hard, this fast…
 | Gold Bugs Should Watch Out For These Warning Signals
| | | Gold has surged this year, and now is up more than 40% year over year. You'd have to go back to 1979 to find a year in which gold rallied this strongly by mid-September. Back then, it tacked on almost another 50% by year-end.
The chart below shows gold since 2005, with the orange markers indicating times when gold was up at least 40% over the previous 12 months. Those past occurrences don't look like the best of times for gold. In this article, I'll quantify gold returns based on its performance over the past year. This could give us insight into the likelihood of this momentum continuing. | 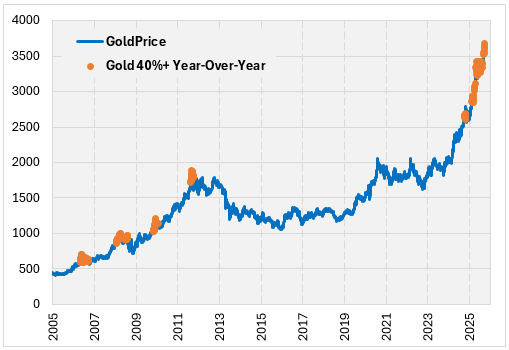 | | Terrified you'll miss the next Nvidia? (Read this) | Is Gold's Rally Sustainable?
The table below shows gold's one-month performance based on its return over the previous 52 weeks, with the data going back to 1980. Right now, gold is up 40% year-over-year, placing us in the bottom row of the table. Historically, the stronger gold's 12-month gains, the better its next month returns tended to be – up to a point. Once the prior year's return hit 40%, the trend reversed, suggesting gold may be overextended. In those cases, the metal averaged a 1.22% loss over the next month, with only 45% of returns positive. Gold outperformed the S&P 500 Index (SPX) just 35% of the time. | 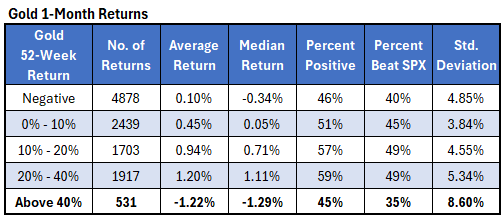 | | Why Apple's latest move has #1 software company's investors excited | | Using the same data, these next two tables summarize longer-term returns for gold. Gold bugs who made money over the past year may want to shift those profits over to stocks. With gold up 40% year-over-year, it has tended to lose 2.18% over the next six months, with 42% of the returns positive and only 29% of them beating the SPX. Over the next year after these huge run-ups, gold declined by over double-digits on average (-11.23%) with just 30% of the returns positive and 20% of them beating stocks. | 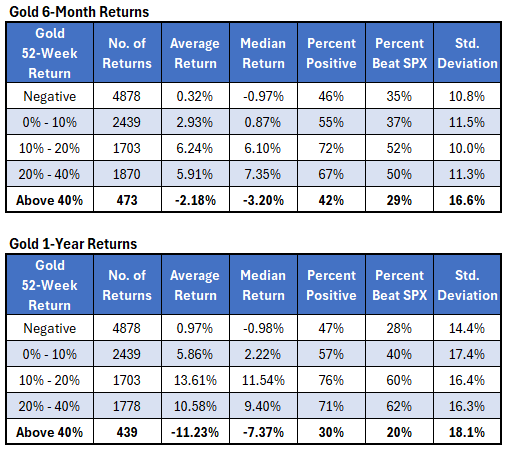 | | Elon and Apple just made waves for US #1 software company | | This last table shows all years in which gold was up at least 20% as of mid-September, along with subsequent returns. I mentioned earlier how in 1979 gold was up even more than this year, and added almost 50% more by the end of the year. That was just one instance, however, and gold has typically been terrible for the remainder of the year after huge gains through mid-September. Excluding 1979, the metal averaged a 7% loss for the remainder of the year, with just one of six returns positive, and that one positive return was just a 1% gain.
History doesn't guarantee what comes next, but based on the data presented here, gold seems stretched with decreased odds of further gains. | 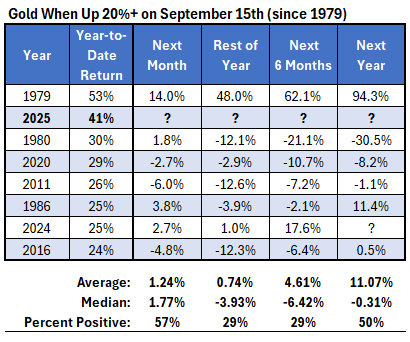 | | | | | | | | | | |


0 Response to "Gold is Surging: What Could Go Wrong?"
Post a Comment