Which way will gold break now?... the bull and bear case... Jerome Powell weighs in on market valuations... why Louis Navellier is watching Trump and September 30... a new investment target for the administration VIEW IN BROWSER Gold set yet another all-time high yesterday. Frankly, this isn’t noteworthy. The yellow metal has hit record highs more than 30 times this year. 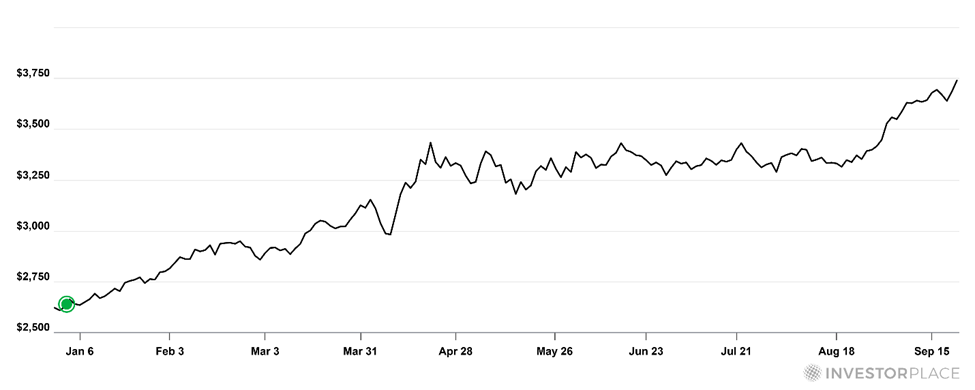 But if the history is right, goldbugs should brace for a pullback – potentially, an extended one. Lucas Downey is quant specialist and the editor of the Alpha Signals trading service at our corporate partner TradeSmith. He’s also a key contributor to the TradeSmith Daily free letter. Given gold’s meteoric gains this year – especially its recent surge – Lucas ran a study to determine what history suggests is next for the precious metal. He began by establishing the parameters of his study using the SPDR Gold Trust (GLD). (Disclaimer: I own GLD.) As of yesterday, the ETF had jumped 13.8% over the prior 24 sessions and had a relative strength index (RSI) above 80. To make sure we’re all on the same page, the RSI is a momentum indicator that measures the extent to which an asset is overbought or oversold. A reading over 70 suggests an asset is “overbought” (and likely poised to pull back as reversion to the mean kicks in) while a reading below 30 means it’s “oversold” (and poised to climb, also thanks to mean reversion). GLD’s RSI of greater than 80 suggests a wildly overbought trade. Here’s Lucas: Going back to 2004 and pulling all instances where GLD gained 13% or more over the same time period and having an RSI of 80 or more, you're left with 13 instances. 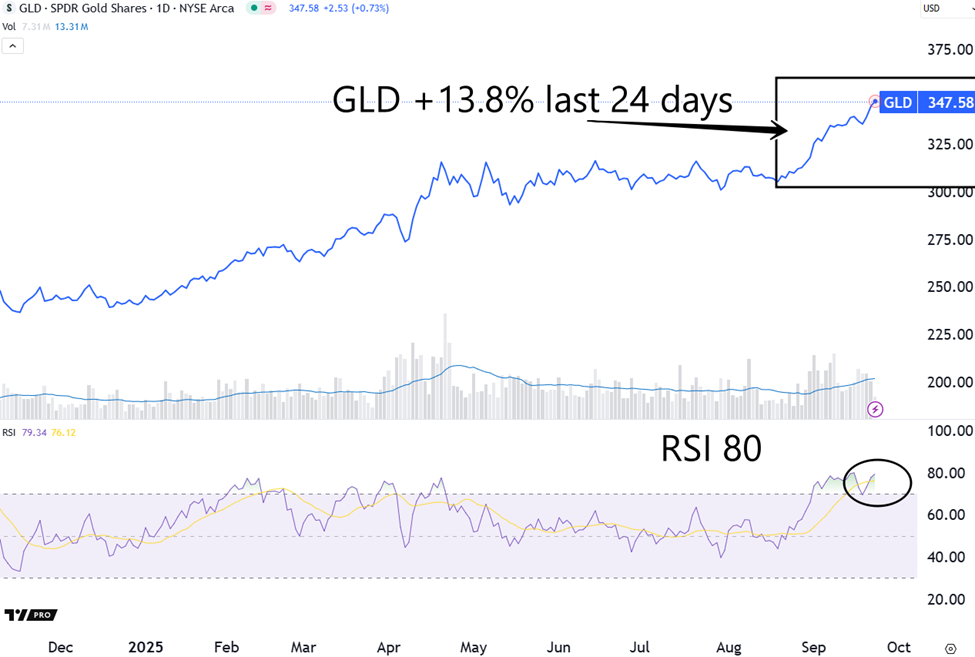 Here's what happened next: • 1M: -1%
• 3M: -3%
• 6M: -3.5%
• 12M: - 3.2%
Sorry, bulls, pain cometh. (For more of Lucas’ fantastic quant studies in the free TradeSmith Daily, click here to sign up.) | Recommended Link | | | | On July 18th, Trump approved a new digital U.S. dollar that’s already used for $27 trillion in payments a year — more than Visa and Mastercard combined. It’s not Bitcoin or a Federal Reserve scheme, but a free-market solution to restore the dollar’s supremacy. See Louis Navellier’s new analysis of Trump’s 21st-century dollar. |  | | Is there anything for bullish goldbugs to hang their hats on? You can’t argue with Lucas’ historical figures or analysis – those are real data points that must be respected. But that doesn’t necessarily mean gold bulls are destined to become gold bears. But before we try to give bulls some comfort, a clarification… Even the most ardent goldbug should prepare for a short-term breather and/or period of consolidation. After all, that RSI reading is red-hot, and trades can’t sprint forever. Looking beyond that, there are at least a few reasons to hold for the long haul… One, global central banks are quietly (and sometimes loudly) hoarding gold even at record levels. This is driven by countries wanting to rely less on the U.S. dollar (aka “de-dollarization”) and protect themselves against global political or economic flare-ups. Here’s Gold.org with recent details: Central banks have accumulated over 1,000t [tonnes] of gold in each of the last three years, up significantly from the 400-500t average over the preceding decade...
Central banks continue to hold favorable expectations on gold. Respondents [of the 2025 survey] overwhelmingly (95%) believe that global central bank gold reserves will increase over the next 12 months. By the way, for context, the market value of 1,000 tonnes of gold is about $121 billion at current prices. Two, real yields remain stubbornly low relative to inflation expectations. Below, we look at the market yield on U.S. Treasuries, adjusted for inflation. If we remove the wildly aberrant zero interest rate policy (ZIRP) period in the 2010s, real yields are actually on the lower side today… 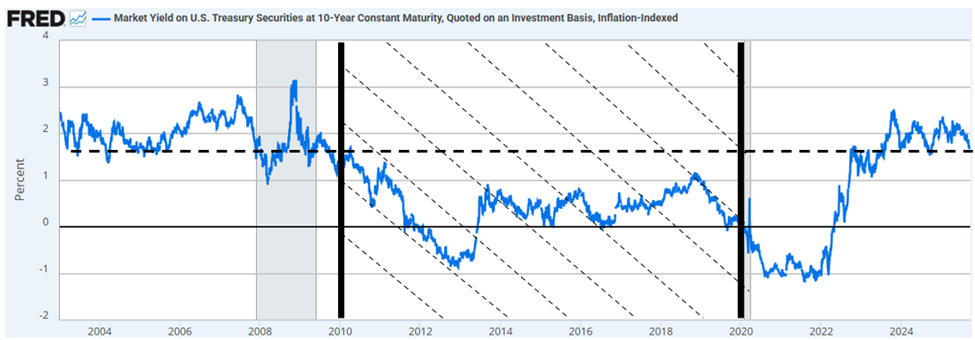 Finally, due to blowout spending from global governments, sentiment is shifting from “trade” to “insurance.” Yes, a frothy RSI might signal traders chasing momentum – so other traders should take notice. But the underlying Big Money buyers (sovereign wealth funds, institutions, and long-term allocators) are less likely to flip positions because a shorter-term momentum indicator is overheated. There are additional reasons for bullishness when we consider gold relative to stocks For this, let’s go to our global macro investing expert, Eric Fry, editor of Fry’s Investment Report. Eric has profited from gold trades countless times over three decades of investing. One of his most recent recommendations was the gold miner Westgold Resources Ltd. (WGXRF). Investment Report subscribers are up 130% since Eric’s January 16 trade alert. Here’s Eric: The stock market's lofty valuation is a possible catalyst for the gold price. A high-priced stock market often presages a major gold rally.
For example, based on month-end price-to-earnings (P/E) ratios during the last 40 years, the months in the highest valuation decile signaled the start of a 52% gold rally over the ensuing five years, on average.
By contrast, months in the lowest valuation decile signaled the start of a 4% gold selloff over the ensuing five years, on average.
Bottom line: Pricey stocks often lead to strong gold rallies.
Given that tendency, coupled with the range of other factors that could trigger the gold-buying impulse, the gold market should continue its record-setting ways for a while longer. Eric added another gold/silver play to his Investment Report portfolio in mid-June. It’s up 15% as I write. To learn more about these picks and get Eric’s latest analysis on gold (as well as silver and copper), click here to learn about joining him in Investment Report. Speaking of "the stock market's lofty valuation," Federal Reserve Chairman Jerome Powell weighed in on stock prices yesterday During a speech, Powell was asked about his take on market prices and how it impacts policy. From Powell: We do look at overall financial conditions, and we ask ourselves whether our policies are affecting financial conditions in a way that is what we're trying to achieve.
But you're right, by many measures, for example, equity prices are fairly highly valued. The market immediately sold off after his comments. Powell’s candid nod to “fairly highly valued” stocks sets the stage for the real story that will impact the market… The Fed’s latest “dot plot” – its projections for future interest rates – and what it signals for the path ahead. After all, it’s how the Fed proceeds with rate cuts, not just a passing comment on stock valuations, that will ultimately dictate how long this market can keep climbing. And that’s where legendary investor Louis Navellier has beef: Have you ever watched an ostrich when it feels threatened?
It doesn't fight. It doesn't run. It buries its head in the sand and pretends the danger isn't there...
It's a survival tactic built on denial. And it rarely ends well.
That's exactly how the Federal Reserve behaved at its September FOMC meeting. In short, though Powell admitted the risks building in the labor and housing markets, Louis says that the Fed took the easy path – burying their heads in the sand. And it’s going to make today’s lopsided market even more one-dimensional: When the Fed acts like an ostrich, the market doesn't rise evenly. It gets narrow.
A handful of stocks take off, while others end up being dead money.
We have two big problems right now: labor and housing. But when you look at that dot plot… It doesn't seem the Fed is willing to do much about either of them. But as we covered last Friday, Louis believes President Trump is about to take action in a variety of sectors. One example is housing, which we profiled last week. Here’s Reuters: President Donald Trump's administration plans new measures to tackle the high cost of housing in the coming weeks, U.S. Treasury Secretary Scott Bessent told Reuters.
Emphasizing the urgency of the situation, Bessent described it as an "all hands on deck" challenge. And Louis writes that it’s not just housing… In recent months, Trump has gotten into bed with Corporate America in the most aggressive way in decades. Two recent examples are government investments in MP Materials Corp. (MP) and Intel Corp. (INTC). And this morning brought a new example… Lithium Americas Corp. (LAC) stock is soaring 93% as I write after news that the Trump administration is seeking an investment position Here’s CNBC: The White House proposed the equity stake as Lithium Americas renegotiates the terms of a $2.2 billion loan from the Department of Energy for its Thacker Pass mine in Nevada...
It is the latest move by the White House to take direct ownership in the mineral supply chain critical to U.S. interests, but the first such stake proposed for a Canadian company. This is a fantastic illustration of President Trump’s impact on the markets, with more public/private investments likely on the way. Louis believes this is just as big of a story for investors as the Fed, since Trump is basically fire-hosing billions of dollars toward various corners of the stock market: While Powell hesitates, President Trump is doing the opposite.
With his legacy on the line, he's pulling out every stop to deliver the boom he's promised.
From tariffs and onshoring to energy and infrastructure, everything is building toward September 30.
That’s when I expect what I call the Trump Shock – a $7 trillion flood of money on the sidelines – to ignite the narrowest, most lucrative bull market we’ve seen in years. Louis has already identified five A-rated stocks flashing “very strong” signals. In a special briefing that you can access here, Louis explains more, and details the significance of September 30. He also gives away the name and ticker of one of the stocks he’s flagged to benefit from this Trump Shock – totally free. Finally, mark your calendar... On Tuesday, September 30, at 1 p.m. ET, TradeSmith’s historic “T-Day Summit” will unveil a powerful new way to trade options – something 99% of investors have never seen. Behind this is Keith Kaplan, CEO of our corporate partner TradeSmith – one of the most advanced quantitative investing firms in the world. On Tuesday, Keith will introduce “The T-Line,” a cutting-edge tool inside TradeSmith’s Options360 service. It pinpoints, in real time, which options contracts are mispriced. It then shows investors when to buy and when to sell for maximum profit potential. The advanced quant tool is based on the unfinished work of a mathematical genius named Ed Thorp. You might know him as the inventor of card counting and author of the book Beat the Dealer, which detailed his mathematical strategy for winning at blackjack. The term “T-Line” is a nod to Thorp and his brilliant mathematical work. We’ll bring you more on this in the coming days, but you can reserve your seat for Tuesday’s event right here. If you’re an options trader, this could redefine what you thought was possible – drawing back the curtain on an entirely new way to pull money out of the market. And if you’re new to options, we encourage you to tune in to learn how to take advantage of these pricing opportunities. The more tools in your investment toolkit the better. More to come… Have a good evening, Jeff Remsburg | 


0 Response to "Is a Golden Bear Coming?"
Post a Comment