You are a free subscriber to Me and the Money Printer. To upgrade to paid and receive the daily Capital Wave Report - which features our Red-Green market signals, subscribe here. When I Say "Chart..." You Say... "Party..." "Chart..."My daughter and wife fell asleep early, and soccer was this morning... eating into my chart time... you know what that means... I'm watching Ballerina and looking at Charts.
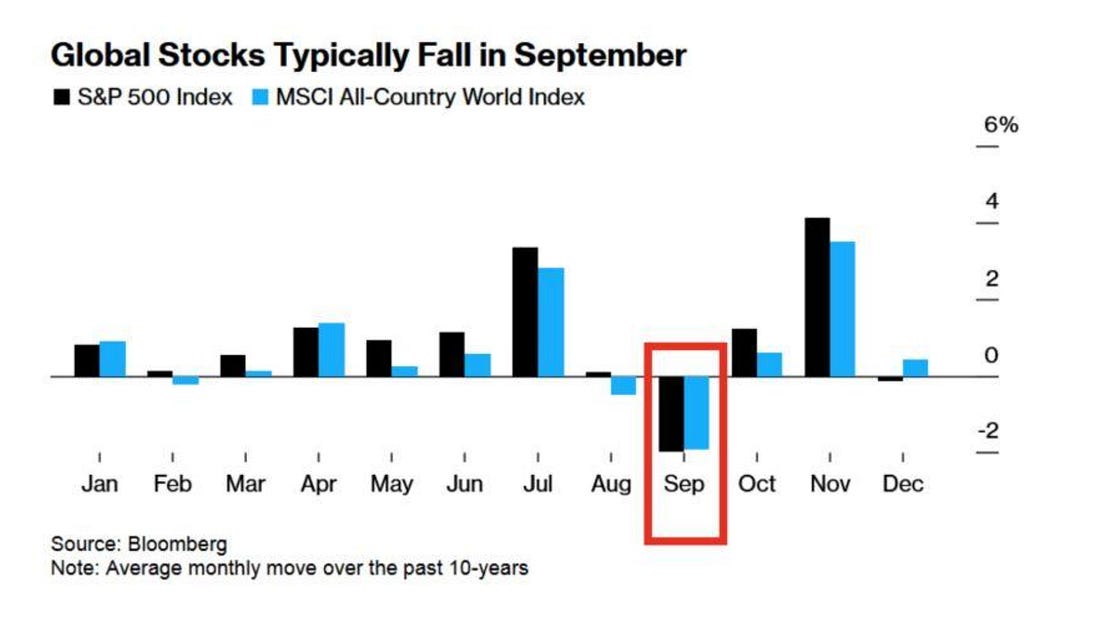
Dear Fellow Traveler: Well, I asked a question yesterday… Am I any good as a soccer coach? Not when it comes to the scoreboard... We lost 3-0. The Dolphins need to work on spacing. We also need to pay attention. Additionally, we should avoid having a goalie walk out of the goal during the game to ask their father what he said, only to have the goalie not be present when the second goal is scored. We’ll be fine, and my daughter is really a more confident player this year. So there’s that… Onto the charts… Chart 1: September - The Worst MonthSeptember's historically the worst month for stocks, averaging a -2% return over the past decade. Four losses in the last five years, including a 9% face-ripper in 2022. Recall, of course, that the GILT Crisis was well underway that year…
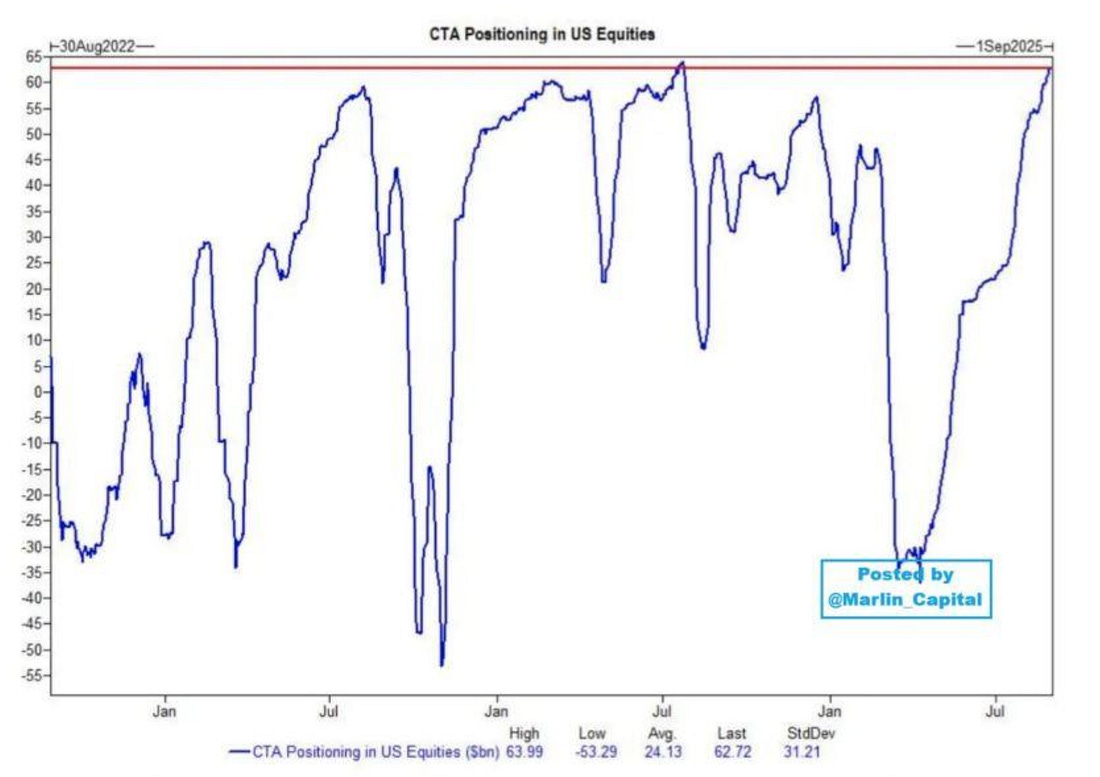
The pattern's so consistent that it's almost boring - institutional money returns from vacation, sees reality, and hits the sell button. But there’s a lot more going on right now… When everyone expects something bad to happen, it usually happens worse. September plus maxed-out CTAs equals danger. Which leads us to… Chart 2: CTAs Are Maxed to the MaxCTAs are incredibly long on US equities. These funds literally cannot buy more stocks. They're holding a massive position with little dry powder. When momentum shifts, computers don't think or hope… they sell billions automatically.
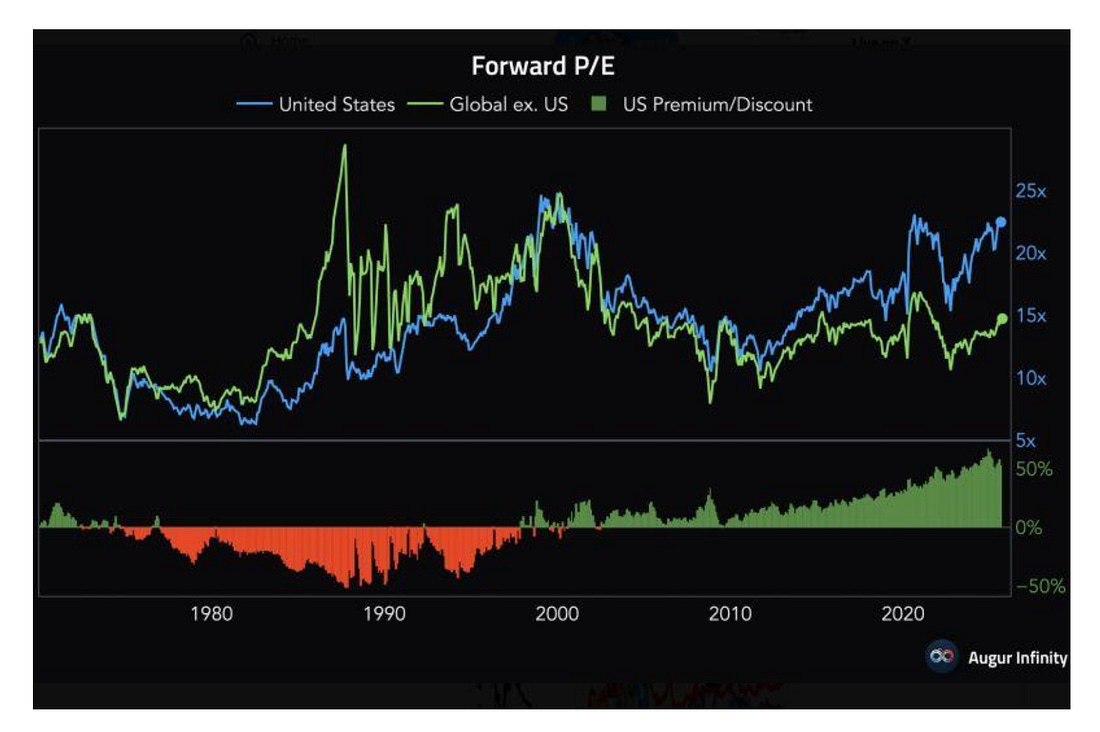
No emotion, no hesitation, just systematic liquidation into a market with no natural buyers. Any unwind will be violent. Watch the FNGD… and be VERY cautious with NVIDIA now pulling lower. So goes NVDA… so goes the market… We’re ready over at the Capital Wave Report if something significant happens this week… Chart 3: US Trading 53% Premium to WorldUS stocks are 53% more expensive than their global peers based on forward P/E. Well… the good news is that forward P/E is a useless statistic…
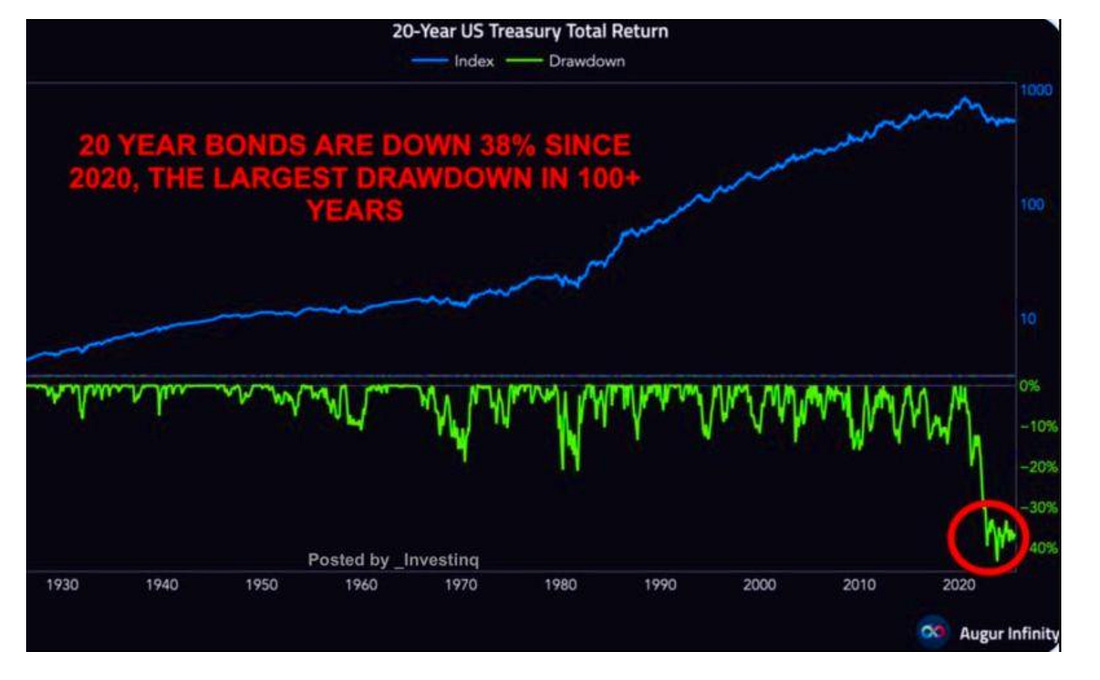
The bad news is that the markets are trading at these levels because of a decade of QE (that pulls money back into U.S. markets, paradoxically), and the never-ending support from the world’s central bank - cough - called the Fed… The same business in Ohio trades at 1.5x the price of its twin in Hamburg. Blame the central bank… This premium infected every sector… Mean reversion will hit one day… Just pay attention to the signals. When the unwind does happen one day… We’ll be on top of it… Chart 4: 20-Year Treasuries Down 38%The "safest asset" delivered its worst century-long drawdown... Grandma's bonds got murdered worse than meme stocks. This is what happens when you print $8 trillion and pretend inflation is "transitory."
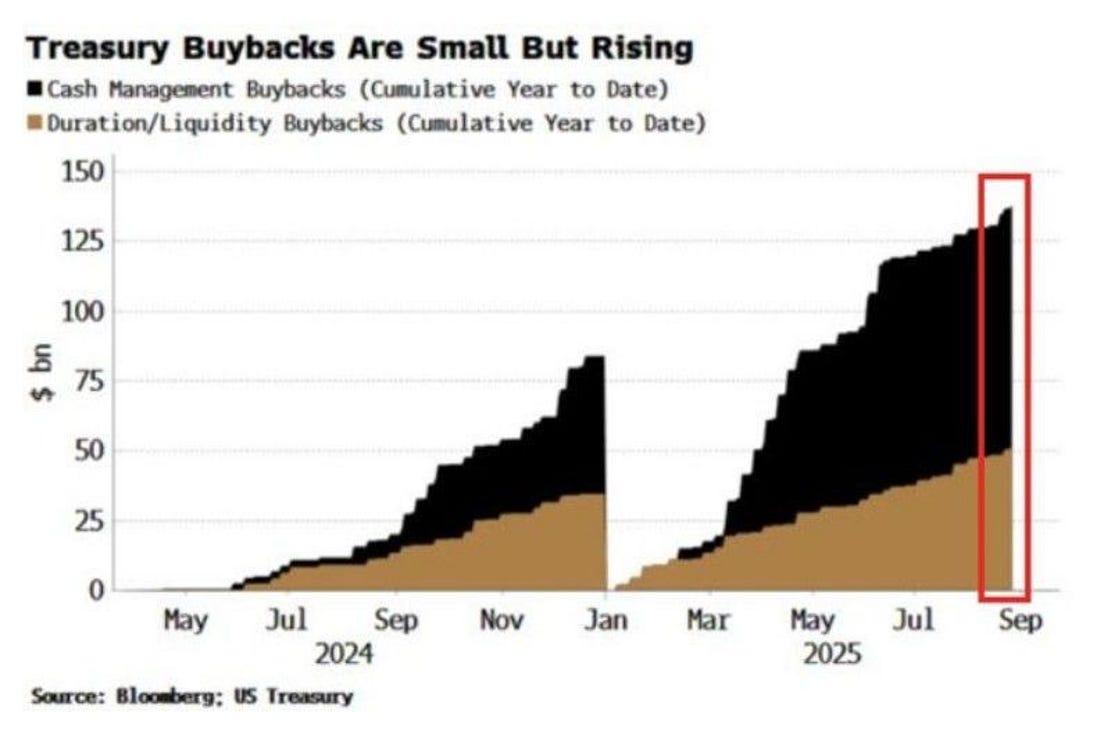
Bond losses this size don't just hurt retirees. They blow up banks, pensions, and insurance companies. The risk-free return became the return-free risk. Chart 5: Treasury Buying Back Its Own BondsThe Treasury bought back $138 billion in bonds this year, nearly double the entire program for 2024. Nothing to see here…
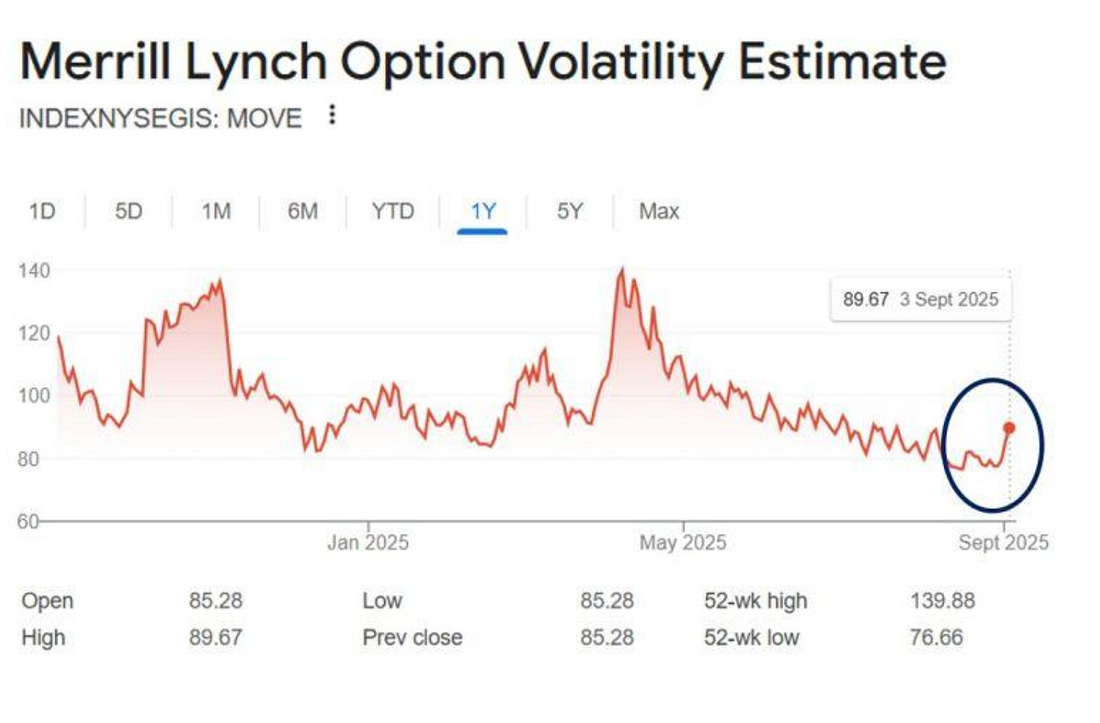
The deepest, most liquid market on Earth needs government CPR to function. When the referee starts playing to keep the game going, something's broken. Foreign buyers vanished, banks are underwater, pensions tapped out - so the government buys… But when the buyer of last resort becomes the only buyer, you're one failed auction from a crisis. They can't print and buy forever. Chart 6: MOVE Index SpikingThe "risk-free" rate is swinging... Nobody knows if the Fed will cut or have a nervous breakdown.
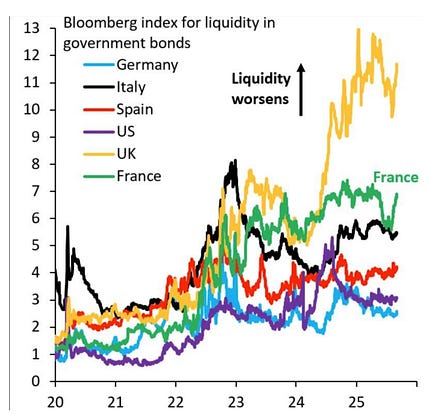
Jobs data is bad… housing's frozen… traditional banks are falling apart… But stocks hit records. YAY!!! The bond market's calling BS on everything. Bond vol doesn't spike alone. It's the earthquake before the tsunami. When you can't price the risk-free rate, you can't price anything. Chart 7: UK Bond Liquidity "Off the Charts"UK bond liquidity is so broken that Bloomberg's chart can't contain it. France is deteriorating rapidly. These aren't emerging markets… they're supposedly sophisticated economies with centuries-old debt markets. The UK's gilt market has more dysfunction than its Parliament.
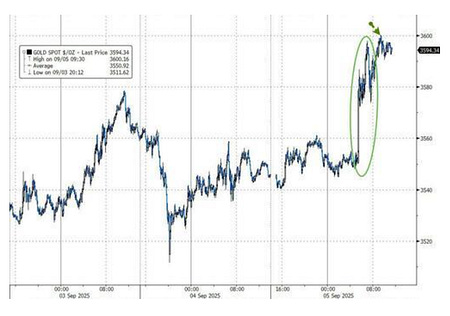
Every trade (or lack there of) moves the market. If the UK's ancient gilt market can break this badly, US Treasuries aren't immune. Contagion starts at the edges and moves to the core. The Fed will have to cooperate like they did in 2022… We're watching the edges crack. Everything operates on bell curves… The bell curves tell us when it’s time to get out of this market… Chart 8: Gold Hits $3,600Gold tagged $3,600 for the first time. Not because of wars or crises…. but because central banks are quietly admitting the fiat experiment is failing.
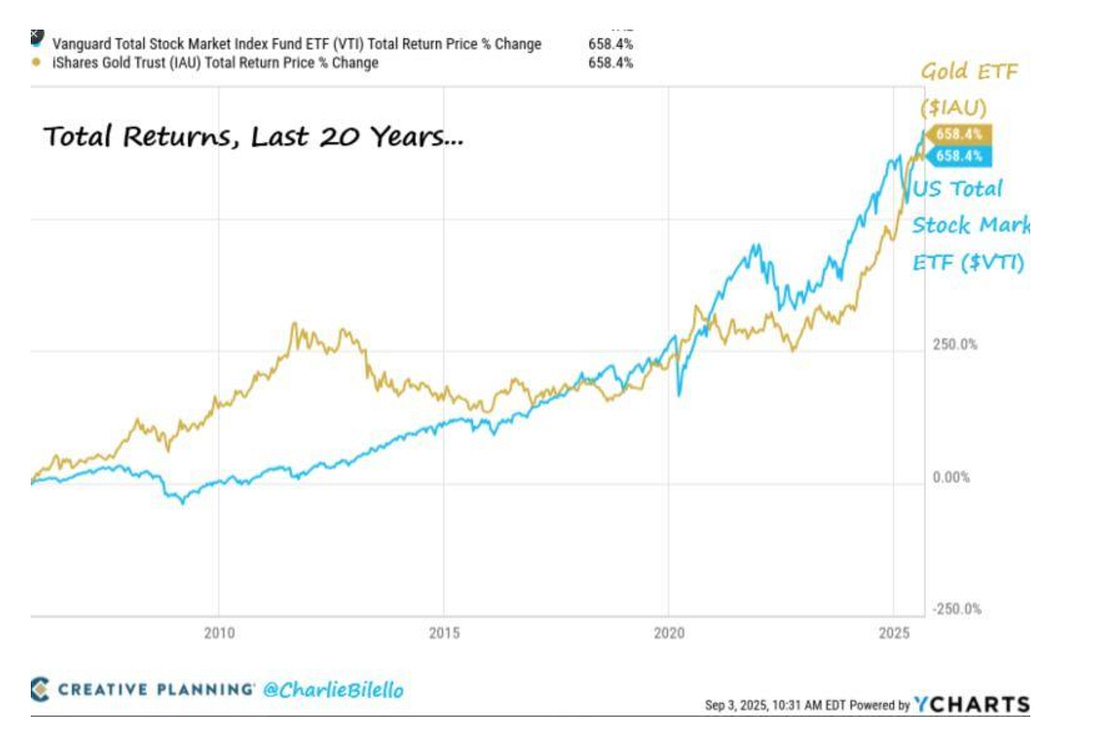
When debt-to-GDP swells and governments borrow to pay interest on their debt, gold stops being a relic and becomes the only asset without counterparty risk. Smart money isn't pessimistic; it just knows how to do math. Gold at these levels is a verdict on paper promises. When faith breaks, $3,600 will seem like a bargain. Chart 9: Gold Matches Stock Returns Over 20 YearsTwenty-year returns: Stocks +658%, Gold +658%. One required analyzing earnings, monetary support, sweating Fed meetings, and surviving multiple 50% drawdowns. The other required buying yellow metal and forgetting about it.
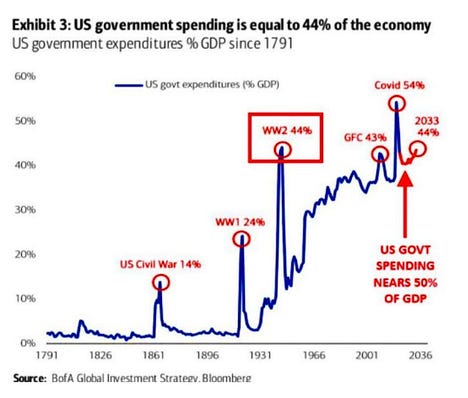
The rock matched the markets without a single earnings call. It's the ultimate middle finger to modern portfolio theory and the Random Walk. When rocks match stocks over decades, it's not about investing… it's about currency debasement. Both are just racing to outrun the money printer. Chart 10: $1.2 Trillion Debt in Two MonthsAmerica added $1.2 trillion in debt in 60 days… That’s $21 billion daily, including weekends. Government spending is at 44% of GDP. We’re at levels reserved for world wars… but there's no war. We're borrowing 7% of GDP to generate 3% growth.
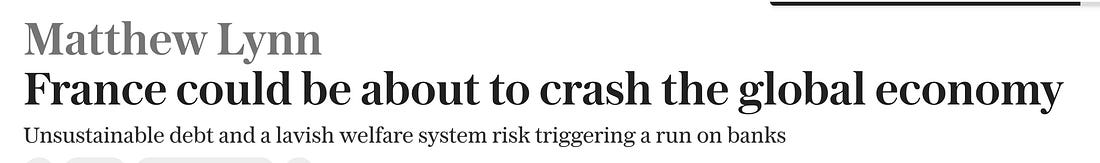
That's not prosperity, it's pulling consumption from unborn grandchildren. Chart 11: France on the Brink of a Global Economic CrisisThe Telegraph says…
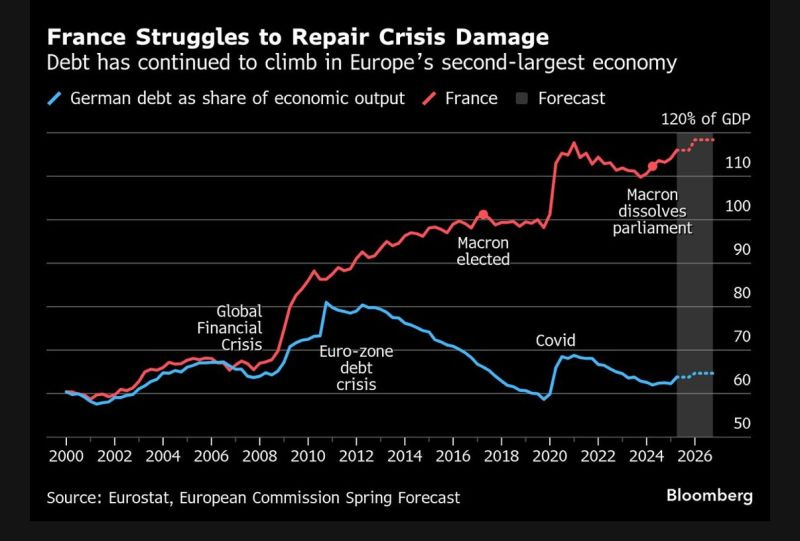
France!!! Their bonds are illiquid… Their debt-to-GDP is approaching Italy’s levels… And their banks are leveraged like 2007 hedge funds. Here’s your first real warning…
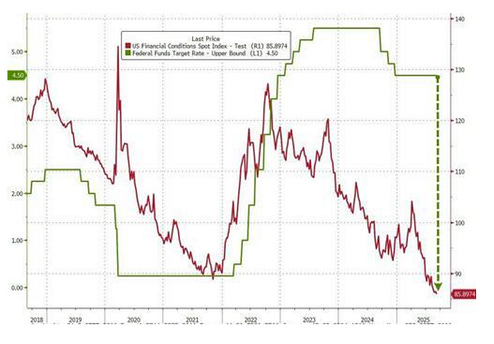
The country that considers 35-hour work weeks oppression is discovering that financial gravity exists. French banks own each other's debt in circular references that would make Excel crash. All proving that Europe's problems aren't contained. I read that Emmanuel Macron was facing opposition over the country’s economic status… and then I thought… wait… How long has this guy been in charge? Does Europe have any other bureaucrats outside of Lagarde, von der Leyen, Macron, and the rest of the clowns there? Is Mario Draghi still around? (he’s still giving keynote speeches to the EU Parliment in 2025… YGTBFKM!) I swear, Europe’s like a shitty television show that’s going onto Season 18… and people are forced to watch it… These people NEED TO GO AWAY. Chart 12: Financial Conditions Loosest Since 2006Financial conditions are the loosest in a long time… Despite inflation, banking stress, and commercial real estate imploding, money's basically being dropped out of a helicopter....
Loose conditions with massive leverage, record valuations, and disappearing liquidity are the recipe for disaster. When this tightens, it'll be involuntary and violent. And they’ll say… “No one could have predicted this crisis…” Then… they’ll turn the money printer on again… BRRRRRRRR… Bonus… HEADLINE: AI Killing Entry-Level JobsStanford says AI has eliminated 13% of jobs for workers aged 22 to 25 since 2022. Customer service, basic accounting, junior coding… they’re all automated.
We're creating a generation with no economic on-ramp. No entry-level means no experience means no career progression. Silicon Valley is building the future by destroying the present workforce. However, stocks are up, so nobody seems to care. When young workers are unable to work, they can't buy the things that matter… This breaks the consumption model that drives 70% of GDP. Revolution starts when opportunity ends. You wonder why the socialists are winning in cities... Wake… Up. Finally…I’m a big John Wick franchise fan… and finally got around to see Ballerina last night… It’s a “world” movie - lateral character that happens while the other Wick timelines are taking place… It’s fantastic… Ana de Armas as an action hero blew the doors off… I grew up on The Fifth Element and Mila Jovovich as the top female action star… de Armas is unbelievably good in this movie… Some lazy producers keep saying, “What if we made James Bond a woman?” No… what if you wrote new characters… like this one? This film doesn’t cheat at all… If you’re a fan of the John Wick franchise, watch it. This is a brilliantly done… and I look forward to five more of them… Stay positive, Garrett Baldwin About Me and the Money Printer Me and the Money Printer is a daily publication covering the financial markets through three critical equations. We track liquidity (money in the financial system), momentum (where money is moving in the system), and insider buying (where Smart Money at companies is moving their money). Combining these elements with a deep understanding of central banking and how the global system works has allowed us to navigate financial cycles and boost our probability of success as investors and traders. This insight is based on roughly 17 years of intensive academic work at four universities, extensive collaboration with market experts, and the joy of trial and error in research. You can take a free look at our worldview and thesis right here. Disclaimer Nothing in this email should be considered personalized financial advice. While we may answer your general customer questions, we are not licensed under securities laws to guide your investment situation. Do not consider any communication between you and Florida Republic employees as financial advice. The communication in this letter is for information and educational purposes unless otherwise strictly worded as a recommendation. Model portfolios are tracked to showcase a variety of academic, fundamental, and technical tools, and insight is provided to help readers gain knowledge and experience. Readers should not trade if they cannot handle a loss and should not trade more than they can afford to lose. There are large amounts of risk in the equity markets. Consider consulting with a professional before making decisions with your money.
|


Subscribe to:
Post Comments (Atom)
0 Response to "When I Say "Chart..." You Say... "Party..." "Chart...""
Post a Comment