You are a free subscriber to Me and the Money Printer. To upgrade to paid and receive the daily Capital Wave Report - which features our Red-Green market signals, subscribe here.
Dear Fellow Traveler: Well… this has been an unusual weekend. I took my daughter bowling yesterday (bad back and all)… it was the new alley near us. We probably go once a month, and she was very eager for me to bowl with her. Typically, I watch her play. But I did bowl… and I was in my prime form in game No. 1. I bowled a 97… beating her by a whopping 16 points. Then, we started the second game… She bowled a 71… And I bowled… a 203.
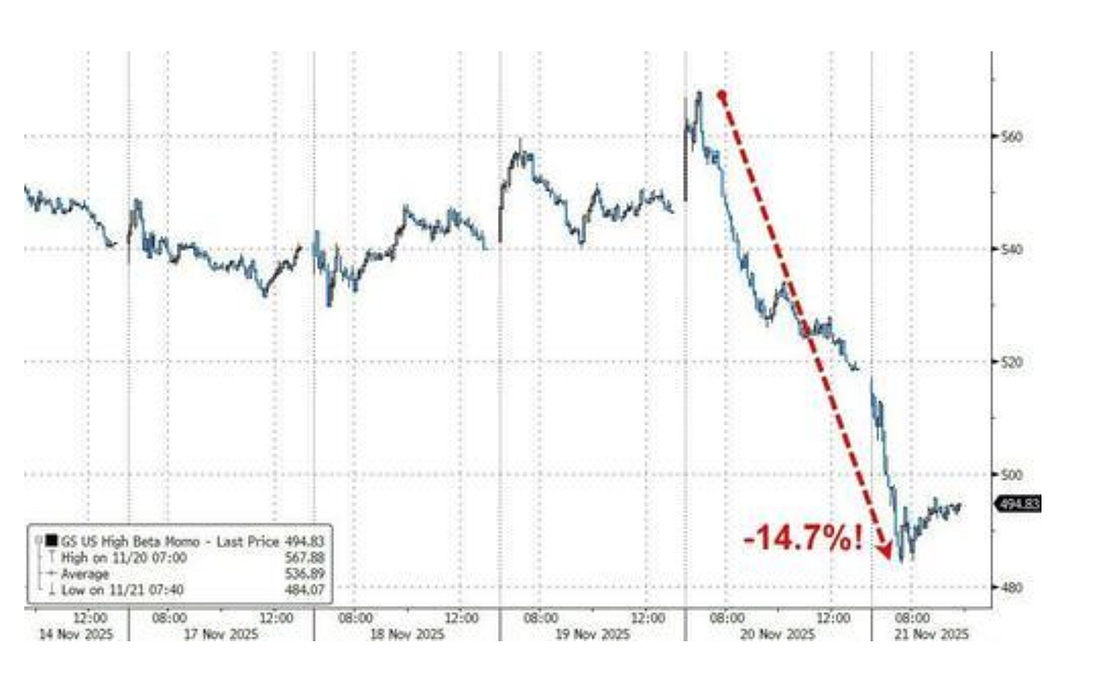
That has never happened before. Complete anomaly… I’ve never marked all 10 frames, and I’m not a very good bowler… My daughter was not at all interested in celebrating my success. Third game? I bowled a 104. Then I spend the rest of the day playing Mario Kart in the arcade and trying to explain what an anamoly is… That’s been a theme of the week anyway… With Momentum RedIt was November 13 when our S&P 500 signal went Red (negative), a warning sign for the market. Our Russell 2000 reading, after some period of chop in October, went negative on October 30. Since both dates, the markets haven’t recovered. Now, I’ve said a few times that I have no idea why the readings go red until a week or two later, but this was one of the rare times when we were able to see the cracks in the repo markets. I’m going to admit that I don’t really think I’m engaging in brain surgery when it comes to the simple math of the market. This is an equation we use… and it’s no different from any physics formula for measuring gravity or a metric for measuring force. It works because it’s not an algorithm… It’s not a model… and it’s not some hunch. It’s a measure of performance relative to a bell curve of all stocks listed in the market. And as we know, since stocks rise and fall all the time, sudden movements on the edges tell us something important… Leverage is leaving the system. There are still skeptics, and I get it. But I’ll give you the basics really quick… I have been influenced by incredible mathematicians like Wes Grey, Gary Antonacci, and JD Henning, as well as by the work I’ve done with Tim Melvin on measuring MACD and other oscillators. The math is really simple. You can do it yourself if you really feel like figuring out all the different betas and coefficients for each sector. But if you want to do the math yourself to identify possible warning signs, just take the number of stocks that are up 5% on the week, up on the month, and have a Beta over 1. This is A… Then take the number of stocks down 5% on the week, down on the month, and with a Beta over 1. This is B. If A is smaller than B, look at the FNGD. If the FNGD is over the 20-day moving average, be very cautious. If it’s over the 50-day moving average… there’s a problem. That’s the Poor Man’s Version of this. Or if you want to build your own system, you can read Henning’s Ph.D dissertation, which is probably the single most important academic study in finance this century. Now… we’re only a little more than 4% from all-time highs on the S&P… but you can sense the panic. The more speculative, higher beta names are getting hit hard… And anyone who recommended names like Rigetti Computing (RGTI) into this negative momentum event is looking pretty foolish right now. That’s WHY you follow these signals. That’s why this IS a newsletter that can be sold… It acts as insurance… If someone tells you to buy something with a high beta and this signal is RED, you wait until it goes green. That’s it… I can’t stress this enough. If you’re not following our reading in the morning… and getting the updates, I encourage you to join us. You get a write up EVERY morning… and if there are changes, you get a quick intraday update. Last week… this was the update on November 13… Now that we’re a good week and a half since the signal went negative, let’s look at what’s happened since. As I said… I’ve warned about Japan and the repo markets for months… and it was just a matter of time. But as you likely saw, it took two months for this all to shake out. Which is why I never bet against the equation. I don’t guess. Let’s look at the aftermath of the negative signals… Chart 1: Momentum Crushed…The signal went negative. The selling pressure intensified. And then, momentum stocks had their worst week since the height of the GILT Crisis in November 2022. Here’s the Goldman Sachs high-beta basket… taking a nose dive…
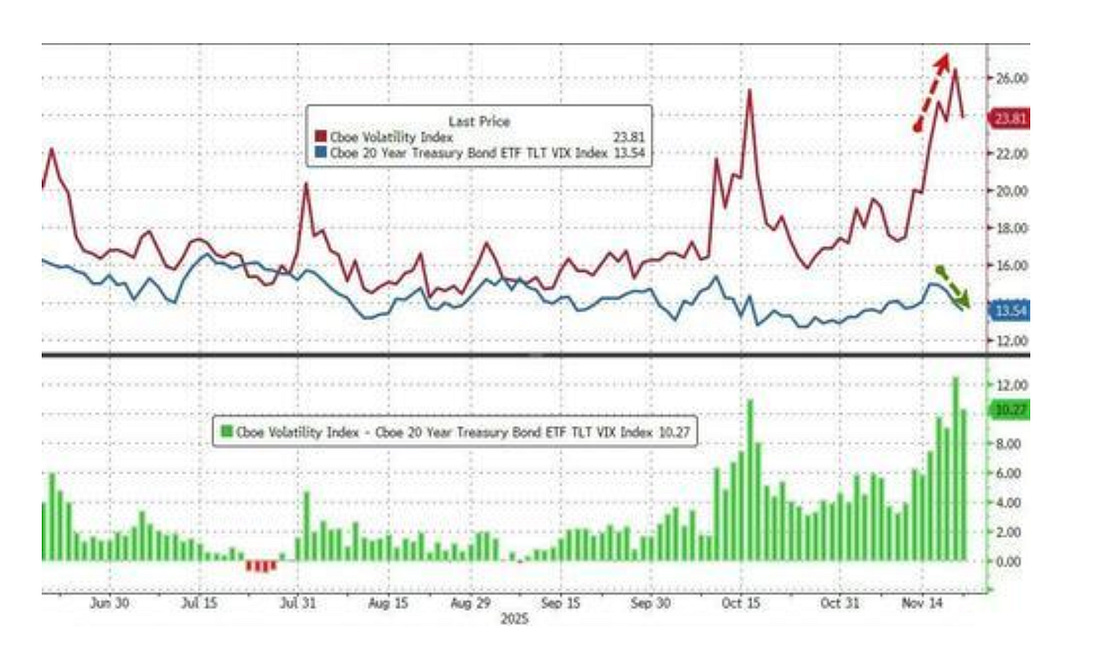
Again, it’s all an equation. Money in, money out… and it’s very predictive. I said last week that I was building a bigger cash pile. Now we wait to see if the Bank of Japan will get to work to stabilize things… or if the Fed’s gonna have to step in and help. I know that our reading chopped for a few weeks… but these big drawdown weeks ONLY happen when the signal has gone red first. The really important thing about this is that we don’t know why until we actually do the autopsy. On June 8, 2022, we had a similar event. This reading went negative, and the S&P 500 fell by 15% in a week and a half. It wasn’t until nine days later that the Commitment of Traders report confirmed the largest hedge fund selloff in 15 years. Chart No. 2: Volatility SwelledSame story… You can watch the FNGD or you can watch the UVXY. Both are good clues for volatility and deleveraging… We don’t really see the VIX go above 20 until it turns RED. Because the reading appears to measure deleveraging…
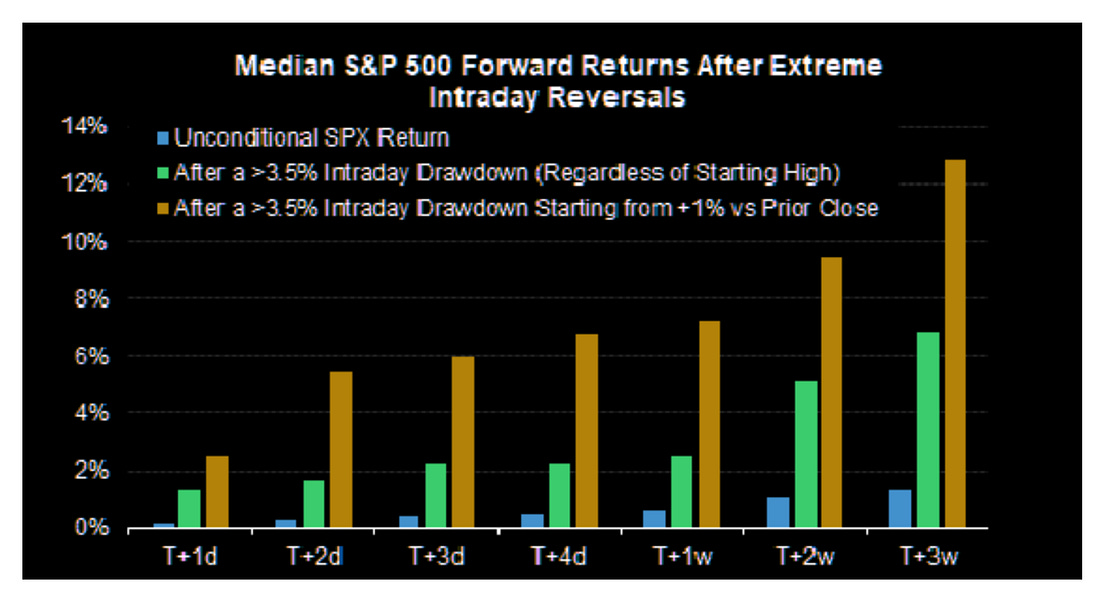
It’s more of a liquidity measurement than I thought… Chart 3: A Big Intraday ReversalThis is important. We’ve seen the number of breakout stocks on the poor man’s equation… hit this week. That’s a contrarian bull case. We saw insider buying to selling hit the highest level in real dollars since April. That’s a contrarian bull case… We saw Japan announce accommodation to the markets… that’s a bull case. But we also just saw a big intraday reversal…
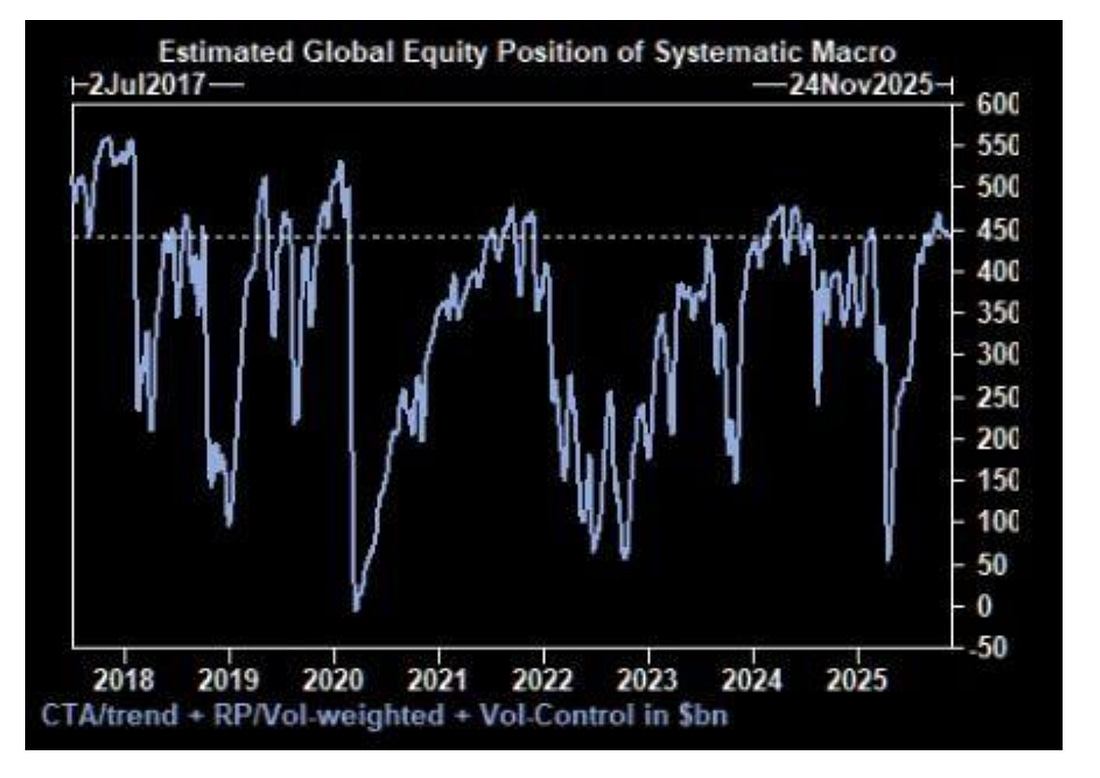
Markets like that… so… just saying… if you’re looking for a bull case… it’s kind of here… Chart No. 4: But the Bear Case is HereThere’s another side to this… Goldman did point out that CTAs could dump another $220 billion in stocks if there’s continued pressure…
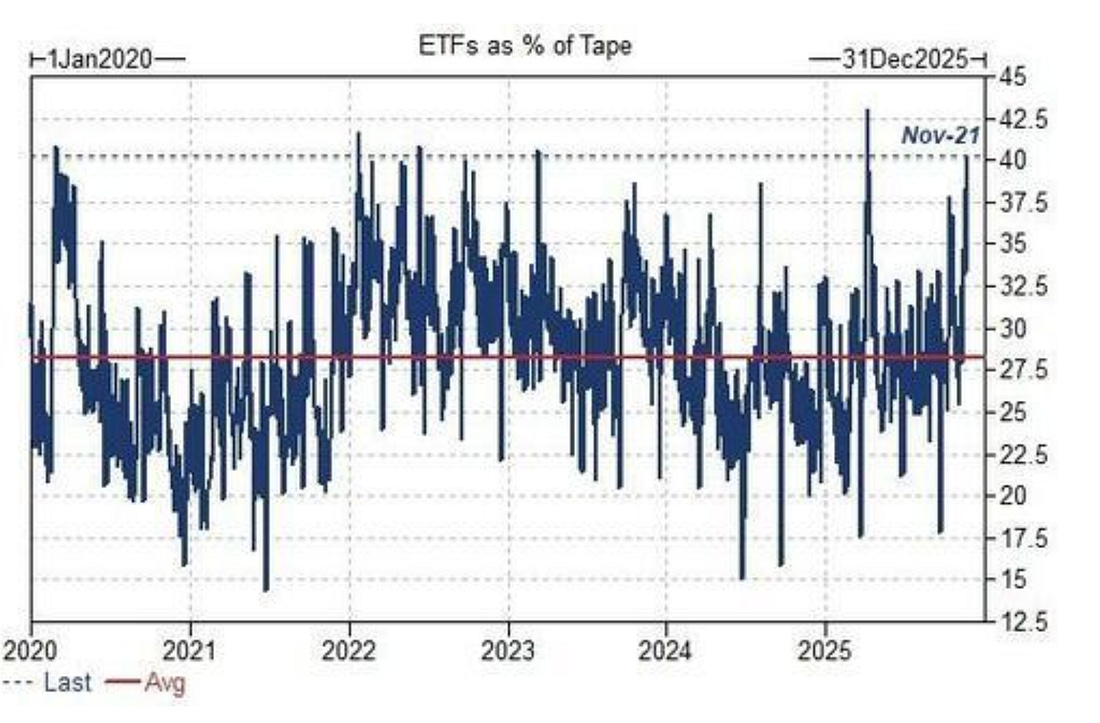
What are we looking for on the bullish side or the bearish side? On the bull side, you need to see multiple days of buying, and the number of stocks in that breakout equation rising. You’d need to see the equity markets push back above key moving averages. But… you also need to make sure you keep an eye on those averages, like the 20-day EMA. The danger remains the same… The CTAs could use any upward momentum to sell back into that pressure… So… obey the signal. If it goes green and red again… get out of the way… It’s okay if we get faked out… but it’s insane to try to buy and then hold through downward pressure… Finally: This is ImportantWhat’s driving the tape? It’s not value arbitrage… It’s the freaking passive investors…
ETFs are 40% of the tape… and top book liquidity is in the dog house… Look, we’re not out of the woods yet… What’s Up This Week?
In Case You Missed ItSo… let’s remind you that I write a lot of articles… Monday, November 17ETFs: Great Work if You Can Get ItPassive investing… that’s a thing… Want to make $3 million doing… what again? Tuesday, November 18Expectations Versus Reality in the Inflation Food FightThe Fed says one thing… but reality says the other when it comes to monetary policy. If you’re not watching what the Fed is doing right now… here’s all you need to know. Wednesday, November 19The Game You Can’t Record For Free...Remember that Postcards will return in a week (yes ONE WEEK…) So, here’s a preview of the greatest letter in the history of the universe… Read it here. Thursday, November 20NVIDIA Earnings: The Good, the Bad, and the WTH?Well, this is the most comprehensive take on NVIDIA earnings… Well… sort of… Friday, November 21Everyone... Everywhere About to Become an Expert on the Bank of Japan...Japan just issued a massive bailout… (sorry, stimulus). So what can you expect? Saturday, November 22Josh is Not an Idiot... and Other Things I Think...Mr. Belanger and I went back and forth on Liberty Energy… And you should be catching up on these conversation… But that’s just one of the stories that I think. And finally… Postcards comes back next week… you can sign up right here… But now’s the time to be looking at my Insider Buying Report as well. Insider buying has picked up in recent days, and there’s lots of value being scooped up right now. This is a deal for readers of Me and the Money Printer… Stay positive, Garrett Baldwin About Me and the Money Printer Me and the Money Printer is a daily publication covering the financial markets through three critical equations. We track liquidity (money in the financial system), momentum (where money is moving in the system), and insider buying (where Smart Money at companies is moving their money). Combining these elements with a deep understanding of central banking and how the global system works has allowed us to navigate financial cycles and boost our probability of success as investors and traders. This insight is based on roughly 17 years of intensive academic work at four universities, extensive collaboration with market experts, and the joy of trial and error in research. You can take a free look at our worldview and thesis right here. Disclaimer Nothing in this email should be considered personalized financial advice. While we may answer your general customer questions, we are not licensed under securities laws to guide your investment situation. Do not consider any communication between you and Florida Republic employees as financial advice. The communication in this letter is for information and educational purposes unless otherwise strictly worded as a recommendation. Model portfolios are tracked to showcase a variety of academic, fundamental, and technical tools, and insight is provided to help readers gain knowledge and experience. Readers should not trade if they cannot handle a loss and should not trade more than they can afford to lose. There are large amounts of risk in the equity markets. Consider consulting with a professional before making decisions with your money.
|


Subscribe to:
Post Comments (Atom)
0 Response to "Chart Party Autopsy and the Week in Review"
Post a Comment