You are a free subscriber to Me and the Money Printer. To upgrade to paid and receive the daily Capital Wave Report - which features our Red-Green market signals, subscribe here. "Money Printing" and a Saturday Chart Party...There's more than one way to debase a currency... it's just different than what was in my textbooks...
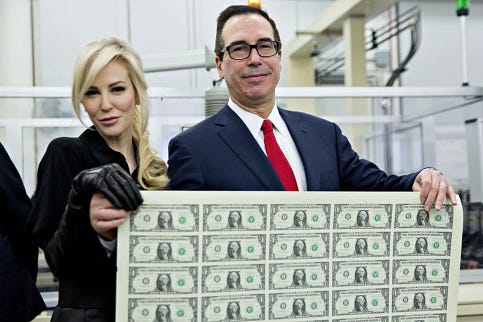
Dear Fellow Traveler: Some people asked me what the characters' names are in the cartoons… The boy’s name is Frankie Pivot… The tiger is General Tso Paws. Both represent the naivety of central banking in the post-2008 financial world… and the leaders of the ongoing capital and resource battles in the global market (The U.S. and China)... But I have to explain what money printing is… and how it relates to this Substack... Let’s Talk About Debasement… and “Money Printing”…People think the dollar only loses value when the government prints too much money. That’s the traditional idea of monetary debasement... More dollars are chasing the same stuff, so prices go up, and your dollar buys less. That part is true, but it’s only half the story in the post-2008, 2017, and 2020 world. The current debasement issue isn’t really about “printing” more dollars... (and then weirdly have your wife show those dollars off…)
There’s another way the dollar gets weakened that doesn’t involve printing a single new bill. And it’s happening right now, traditional economists argue about official money-supply charts. Here’s how it works, and it’s simpler than it sounds. The World Outside…Banks and other big institutional investors borrow money every day using the same pile of government bonds as collateral. They take those bonds, lend them out, get them back, then lend them out again... Over and over. According to a 2018 Federal Reserve study using confidential bank data, government bonds can be reused several times through these lending chains… Some analyses stated at the time that this reuse set claims of 5x to 9× on every bond in active markets. The Fed’s 2018 study, “The Ins and Outs of Collateral Re-use,” and related research confirm that securities can circulate multiple times through the financial system before returning to the original owner. That means every $1 of actual government bonds supports $5 to $9 worth of financial transactions. Today’s debasement is largely the multiplication of dollar claims through financial leverage that drives up asset prices... Think of it like this… and yes… I’m simplifying… You have one car, but you write nine different IOUs promising that car to nine different people. Now nine people think they can get your car, but there’s still only one actual car. Why This Matters to YouSome of this activity shows up in official money-supply measures, but the full scope of this lending and re-lending doesn’t get captured in traditional money charts. That said… these shadow money claims are used to bid on the same “scarce” things you want to buy... houses, stocks, and land. This shadow liquidity helps explain why financial and real assets, including housing, have surged far faster than CPI since February 2020… Of course, a traditional economist will say, “That’s just lending. It can shrink back down when loans get repaid.” That used to be true... But not anymore. The entire system now depends on continuously rolling over all this debt. Market analysts estimate that the majority… perhaps 70% or more (and I’ve seen estimates much higher from CrossBorder Capital)… of financial market activity today involves refinancing old debt rather than funding new productive business. If this lending chain suddenly stopped... if everyone tried to collect on their IOUs at once... the whole thing could create massive financial stress… Like we saw in 2008-09 or 2020… So the system has evolved to keep rolling these claims forward forever. Every expiring loan gets replaced by a new one. That shadow money rarely goes away… unless a crisis forces deleveraging. Where Your “Safe” Money GoesRemember those money market funds that pay you 4.5%? The $7.5 trillion that everyone thinks is “cash on the sidelines”? Much of that money gets lent out each night through repo markets to fund the same asset speculation that’s driving prices higher. The new liquidity inflates financial assets (equities, real estate, venture valuations) rather than CPI goods. A single mortgage can sit at the base of complex derivative structures with notional exposure worth tens of millions... When those trades end, they get refinanced rather than unwound, because unwinding would force massive asset sales. We don’t “print money…” so much as we expand the number of promises or claims on collateralized assets… which leads to debasement. So even when the Federal Reserve isn’t actively expanding its balance sheet, the financial system keeps creating new money-like claims that compete with you for the same assets. And each of those IOUs… is money… If two banks lend each other $1 billion in repo overnight, they’ve created a temporary dollar… They’ve created a short-term claim that buys assets and settles debts. These IOUs achieve what money does…
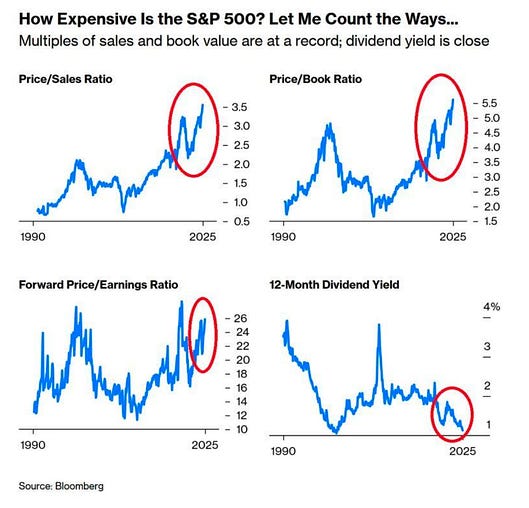
It’s Not Printed Debasement. It’s More Structural.While official money measures track household cash and bank deposits, this shadow layer tracks institutional money that bids against you in asset markets. The effect on your purchasing power is similar to money printing, but it works through secured lending and bond re-use rather than direct money creation. This helps explain why stocks trade at nosebleed valuations while the economy grows at 2%. The debasement isn’t just happening through currency destruction... It’s happening because the financial system creates multiple claims on the same real assets, driving up prices. It works beautifully… Until someone doubts the collateral. Then everyone demands “real” dollars back or the underlying assets. And that’s where things get really fair… really quickly… Traditional analysis focuses on what central banks create directly while missing what the financial system creates indirectly through bond lending and re-use. Your purchasing power gets hurt whether dollars are printed by the government or created through shadow banking... Your money buys less house, less stock, and less financial security. That’s a structural issue... And it’s happening whether the printing presses are running or not. Now… let’s look at some charts… Chart No. 1: But It’s NOT Debasement?We start here… The S&P 500 is now more expensive than the Dot-Com Bubble…
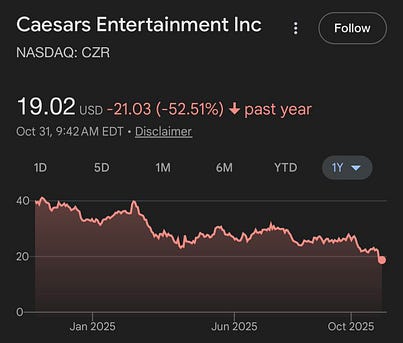
And again… the S&P 500 has seen an even greater explosion of passive investment (who cares about valuations when there are fees to be made…) and the leverage I discussed above. Your money buys a smaller claim on earnings, fewer dividends, and less revenue… But it’s all based on rational behavior… right? Chart 2: Meanwhile in the Real EconomyNINETY… THOUSAND… EMPTY… ROOMS… That’s what Caesars Entertainment reported through the end of the summer… The American consumer is strapped…
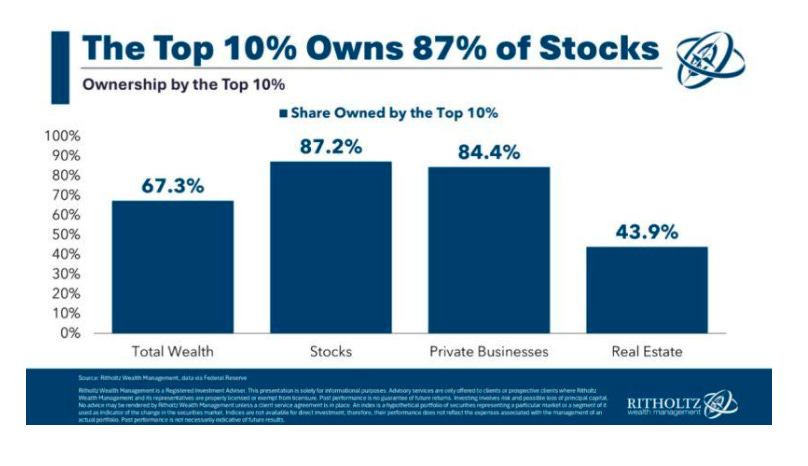
But… we’re at all-time highs on the S&P 500… It’s funny because instead of worrying about the American consumer (and lowering interest rates and properly targeting inflation and the ongoing weakness of purchasing power), the Fed is likely going to inject more money into the plumbing of the financial system… because… well… Who do they really work for? This is at the heart of every K-shaped recovery that we’ve had dating back to the 2008 Financial Crisis… Here’s one chart that shows what the hell has happened in this country since the financialization accelerated…
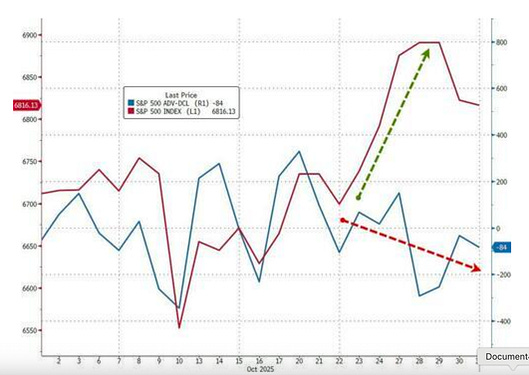
People wonder why Mamdami is going to win this week. Because this economy is now too heavily based on extraction and financialization. People who don’t see this have their heads in the sand… Chart 3: Yeah, Something’s Off…This week in the markets was pretty ugly… And there’s clearly something building. The MAG 7 carried the S&P 500 up… but the bottom 493 stocks on the index were effectively flat. Regional banks, private equity, and private credit were weak.
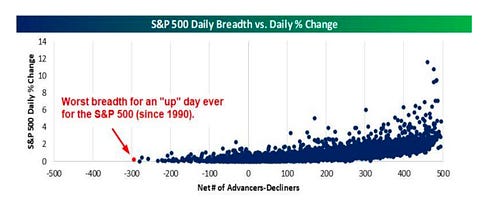
And on Wednesday, we had the worst breadth for the S&P 500 since 1990… S&P 500 was up 0.23%… while the net advance/decline of the index was a staggering MINUS 294.
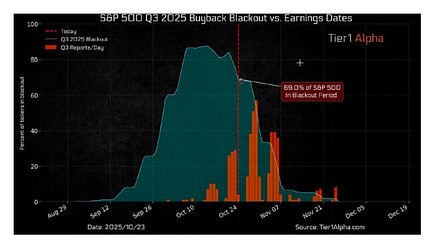
What’s the adage? Why was the market down today? More sellers than buyers? Well… that feels a little backward for this environment… The Fed is going to end QT in December, but won’t commit to more cuts… Fine… But there’s something off in the plumbing. The SOFR rate has been trickling higher than the Fed Funds Rate a few times recently (secured lending rates moving higher than unsecured lending… which is bizarre… and a reminder of the 2019 spasm that led the Fed to pump capital into the system - while claiming it totally wasn’t a form of easing - even though it was a form of system support)… The issue is what happens if SOFR spikes and leverage starts to unwind? There are clear concerns about the “cockroaches” that Jamie Dimon discussed recently in the private credit markets. The latest cockroach to arrive as But we’ll see where the entire nest is when we see the tide really pull back - similar to what we saw in 2022 with FTX and Luna… and some of the other fun schemes uncovered when the water recedes and we see who isn’t wearing shorts… Final Charts: But For Now… Be Bullish?Well… while all this is going on… and there’s concern about the plumbing… There are reasons to be bullish… especially if the Fed does pump some support… The buyout blackout is about to end…
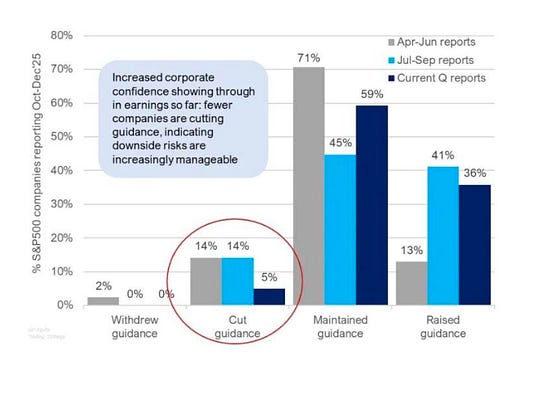
There’s a lot of money about to be deployed… Meanwhile, companies are holding guidance or raising it more than cutting…
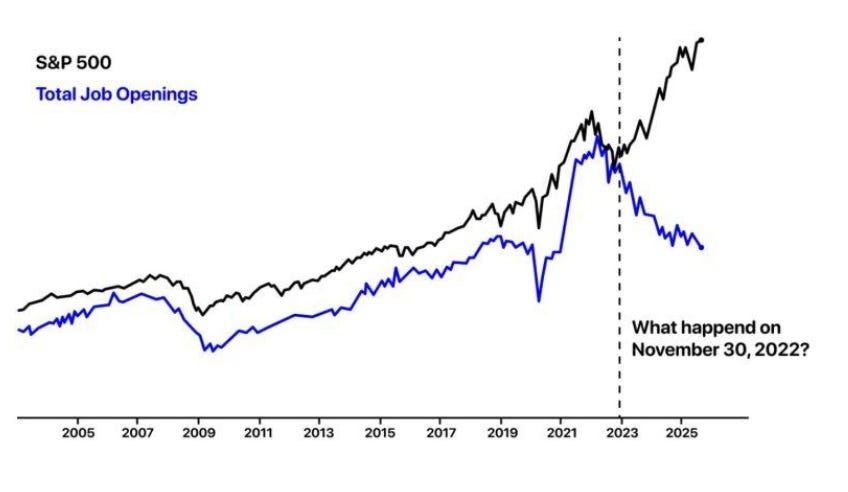
Well, this is good… One Bonus Chart…Submitted without much comment… Here’s the S&P 500 against U.S. job openings…
The answer to the chart’s question? ChatGPT launched on November 30, 2022… Stay positive, Garrett Baldwin About Me and the Money Printer Me and the Money Printer is a daily publication covering the financial markets through three critical equations. We track liquidity (money in the financial system), momentum (where money is moving in the system), and insider buying (where Smart Money at companies is moving their money). Combining these elements with a deep understanding of central banking and how the global system works has allowed us to navigate financial cycles and boost our probability of success as investors and traders. This insight is based on roughly 17 years of intensive academic work at four universities, extensive collaboration with market experts, and the joy of trial and error in research. You can take a free look at our worldview and thesis right here. Disclaimer Nothing in this email should be considered personalized financial advice. While we may answer your general customer questions, we are not licensed under securities laws to guide your investment situation. Do not consider any communication between you and Florida Republic employees as financial advice. The communication in this letter is for information and educational purposes unless otherwise strictly worded as a recommendation. Model portfolios are tracked to showcase a variety of academic, fundamental, and technical tools, and insight is provided to help readers gain knowledge and experience. Readers should not trade if they cannot handle a loss and should not trade more than they can afford to lose. There are large amounts of risk in the equity markets. Consider consulting with a professional before making decisions with your money.
|


Subscribe to:
Post Comments (Atom)
0 Response to ""Money Printing" and a Saturday Chart Party..."
Post a Comment