|
|
I'm sitting here on the second to last trading day of the year, looking at silver trading north of $77 as I write this, and honestly? This is what it feels like when you read the charts right. |
Back on January 9th, when I laid out what I called a "golden opportunity in gold and silver," I wasn't throwing darts at a board. Silver was trading around $30. |
I told TheoTrade Chatroom Members it could hit $46-48, maybe even $50. Gold was around $2,660. My top three mining stocks—AGI was at $23, KGC was at $11, GFI was at $18. |
I was following patterns I've been tracking for years. Every one of these calls came from the same place - clean charts, obvious trends, and knowing what to look for when precious metals are setting up to rip. |
As of this writing, silver is up over 155% for the year. My three mining picks averaged over 150% returns. That's what happens when the setup is right and you don't overthink it. |
The Three Charts I Couldn't Ignore |
Let me tell you what I told TheoTrade Chatroom Members in January that made these picks obvious: |
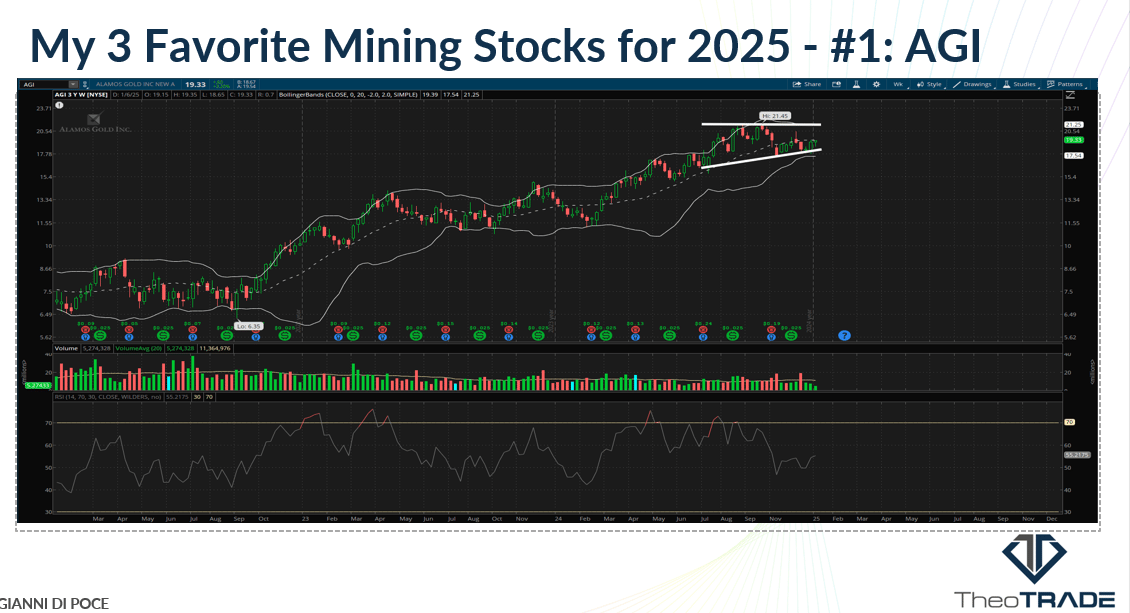
Alamos Gold (AGI): I called $37-38. It's trading around $39.30.
Look, I've seen a lot of mining charts over the years. |
Most of them are choppy garbage that'll give you whiplash. But AGI? Clean uptrend since 2022. Higher highs, higher lows. |
I specifically called out that cup and handle pattern because it was textbook beautiful. When I see a chart that clean in the mining space, I pay attention. |
Most miners can't hold a trend to save their lives. AGI kept up with gold's performance. That told me everything. |
|
Kinross Gold (KGC): I called $21-22. It's trading around $28.90.
Same story here - higher highs and higher lows since the 2022 bottom. But what really got my attention was watching KGC buck the trend when other miners were getting chopped up. |
|
That's relative strength. When a stock refuses to go down with its peers, it's telling you something. I've been trading long enough to listen when the market speaks that clearly. |
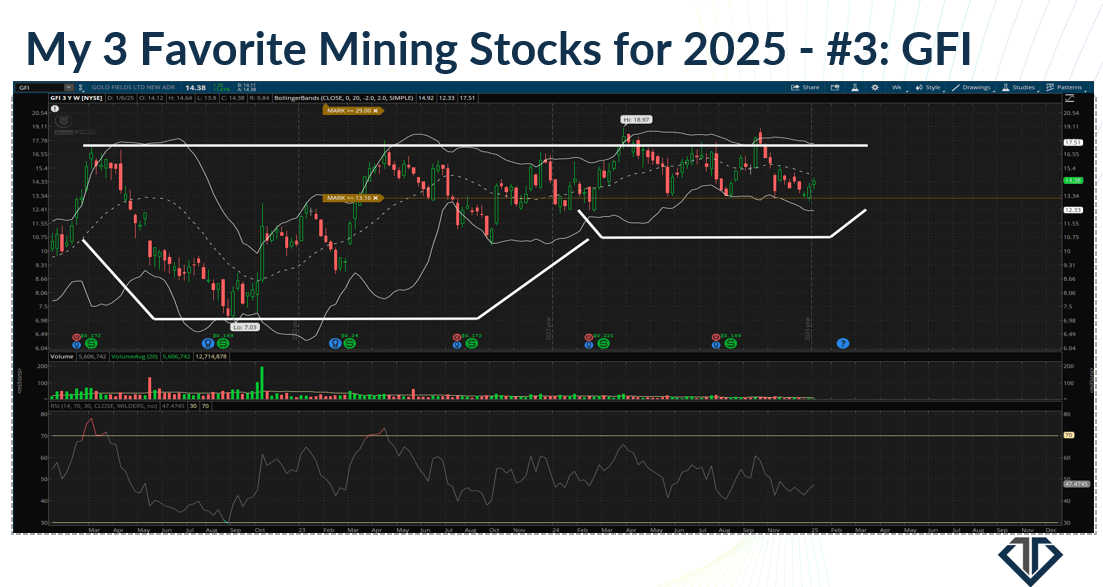
Gold Fields (GFI): I called $29-30. It's trading around $44.30.
This one had the prettiest cup and handle I'd seen in months. I remember saying "this is my cup of tea" because the pattern was so obvious it almost seemed too easy. Sometimes the best trades are the ones that look too simple. |
|
When you see a setup that clean, you don't question it. You act on it. |
How the Ratio Chart Called It All |
Here's what most people completely missed: I wasn't just picking random mining stocks. I was watching the gold-to-silver ratio like a hawk. |
I showed everyone that chart back in January - when this ratio is high, silver starts to outperform gold. |
When silver outperforms gold, you're usually in the sweet spot where miners explode higher. |
It's not complicated. The pattern repeats itself over and over in precious metals cycles. |
Gold's up 64%, silver's up over 155%. The ratio collapsed exactly like the chart said it would. |
More importantly, this told me we were entering the phase where the miners would outrun the metals themselves. Which is exactly what happened. |
The technical picture in January was screaming if you knew how to look. |
Gold breaking out of consolidation. Silver showing relative strength. The Philadelphia Gold and Silver Index in a clean multi-year uptrend. |
But the real edge was recognizing where we were in the cycle. |
I've watched enough precious metals bull markets to know the signs. When you see clean technical setups in quality miners while the underlying metals are setting up for breakouts, you don't hesitate. |
I'm a trend trader. |
Always have been. When I see higher highs and higher lows, especially in names that are bucking the trend of their peers, that gets my attention. When those same names are showing textbook continuation patterns, that gets my money. |
Could I have predicted silver would hit $77? No chance. But I didn't need to. The charts told me these names were setting up for significant moves. |
My job wasn't to predict the exact magnitude - it was to identify the highest probability setups and position accordingly. |
That's the difference between trading and gambling. I don't need to be precisely right. I need to be directionally right with names that have the technical backing to deliver when the sector moves. |
What 2026 Looks Like |
This year proved something I've believed for over a decade: if you can read trends correctly and identify the strongest names in strengthening sectors, the market will reward you. |
It's not about picking the perfect entry or predicting exact tops. It's about recognizing when all the pieces are aligning. |
The same approach that identified these winners is already highlighting some interesting opportunities for 2026. |
Different sectors, different patterns, but the same mechanical way of reading what the market is telling me. |
In the next week, I'll be sharing my top ideas for 2026 in the TheoTrade Chatroom. |
The technical work is almost done, and there are some setups developing that have me genuinely excited about what's ahead. |
2025 reminded me why I love this business. |
When you read the charts right and position accordingly, the market pays you for being prepared. The question is whether you'll be ready when the next obvious setup presents itself. |
Stay tuned. The best opportunities often follow the best years. |
Gianni Di Poce |
P.S. Can't wait till next week? I'm going live on Friday at 12 pm for something really cool… Click here for all the details. The Market You Learned On Doesn't Exist Anymore |
|


0 Response to "The Anatomy of a Perfect Call"
Post a Comment