You are a free subscriber to Me and the Money Printer. To upgrade to paid and receive the daily Capital Wave Report - which features our Red-Green market signals, subscribe here.
Dear Fellow Traveler: It’s Sunday at noon… after yesterday’s Postcard… and the USA-Canada hockey game… I’m a little gassed… I’ve been living in this USA Hockey sweater for the last five days… and I can finally take it off…
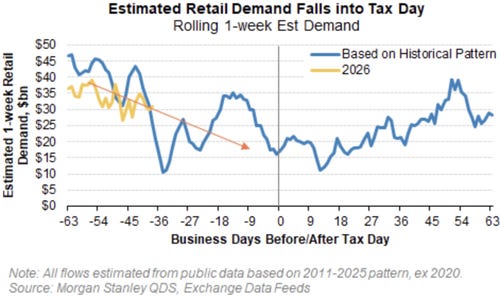
This is better than any day when the Buffalo Bills finally win a Super Bowl… (I think…) Huge day… a great day in U.S. sports… against an impossibly good opponet. It’s 46 years to the day of the Miracle On Ice… and to think I almost overslept today. I assume that they’ll now play eight hours of curling replays on NBC for the rest of the day. So, let’s check out… take a breathe, and get to the charts. Chart 1: A Weaker Retail Season Pending?We head into the back end of February… and into March. As we’ll see, tax season affects retail equity demand. We’re still cautious on the backside of February’s Third Friday… and we keep an eye on the Money Markets and banking reserves…
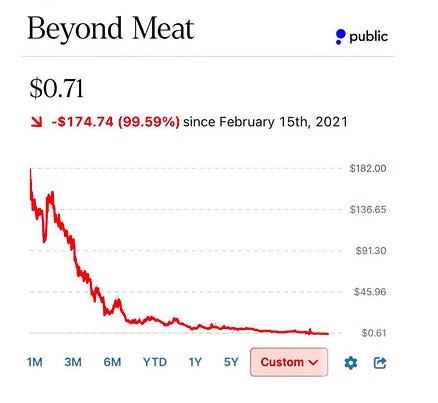
Just remember… the Fed is providing $40 billion in support to the banking reserves each month… all while we just saw another $30 billion in repo last week. Chart 2: 71 (Deserved) Cents to GoWithout little comment aside from a reminder that Beyond Meat remains my least favorite public company of all time… And this chart proves markets work. I have nothing else to say… right?
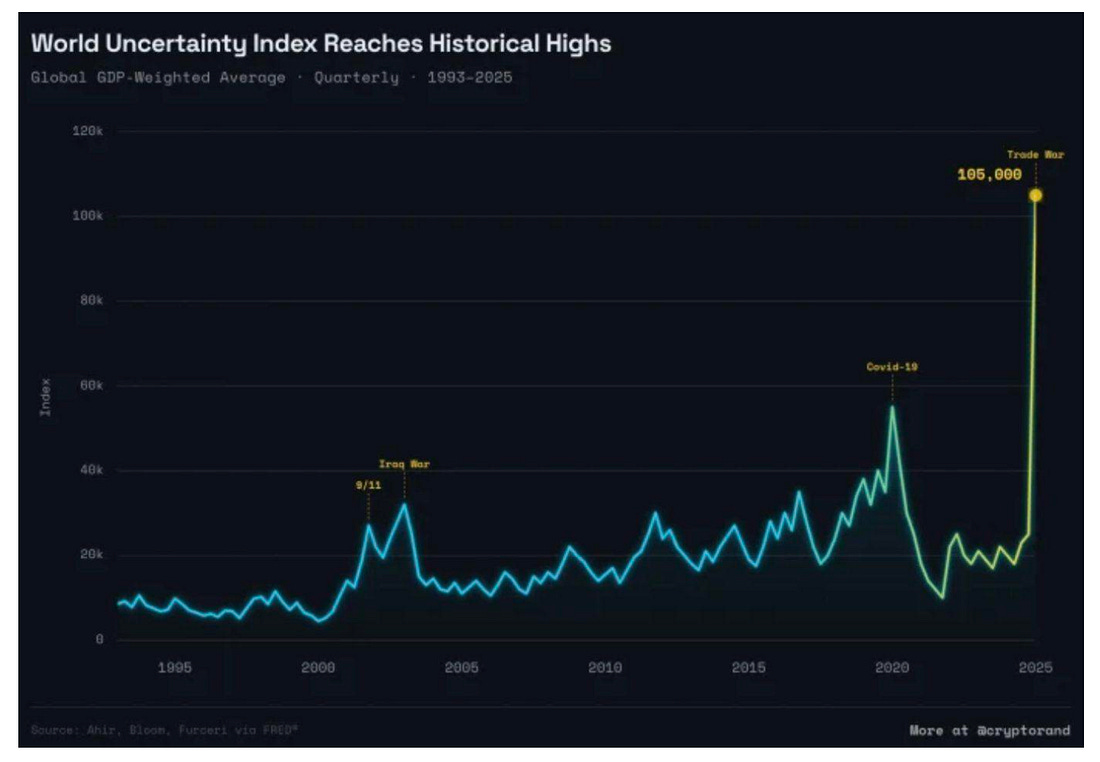
Oh who am I kidding… Go to Zero… you meatless freak! Chart 3: We’ve Never Been More Uncertain?Well, apparantly the World Uncertainty Index has hit a new historical high… Thing is… I have no idea what this really measures… What to eat for dinner? What Netflix film to watch? And whydoes it feel like these charts are made up? Have we never been this uncertain in the wake of 1993? Really? Post 9/11? The 2008 Crisis? COVID? Am I just immune to all of this now?
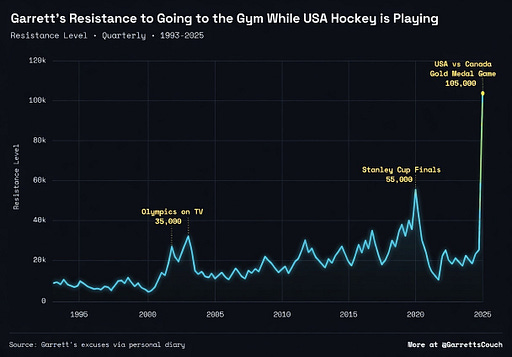
This chart feels like you could make any meme you want out of it… See?
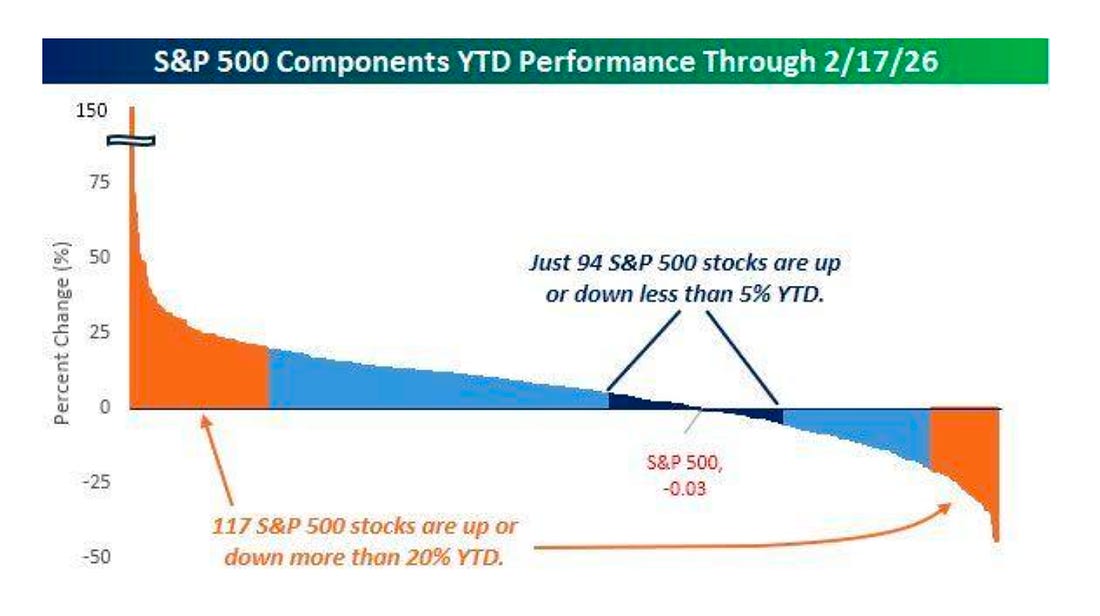
When it comes to “uncertainty”, the obvious temptation is to blame Trump… but I think this is really about the ongoing problems in the global monetary system… The surge of gold and silver justifies it. But I don’t understand how people don’t see that central banks keep doing the same thing over and over again: Printing money… to calm uncertainty. Chart 4: Explaining the ChopThis chart is pretty fascinating… It showcases the extreme moves in S&P 500 stocks at the start of this year. Through Tuesday (2/17), 117 stocks were up ore down more than 20% to start the year…
This is significant because, without a real catalyst, those stocks on the left will likely taper off in gains, putting more pressure on the other side of this chart. This stock market is continually finding support at its 100-day moving average… but sooner or later equity markets will need to make a choice.
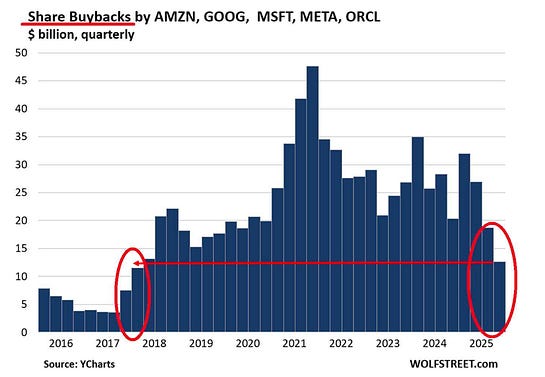
This chart is being captured in our momentum scores, and the total breakout universe is still larger than the breakdown stocks… but the weight that’s on the far right of this chart is more problematic. Chart 5: Something Wrong With the MAG 7?MAG 7 isn’t holding up this year… I’ve talked about the liquidity cycle… the rotation that tends to follow… But remember… a lot of these companies aren’t buying back stock…
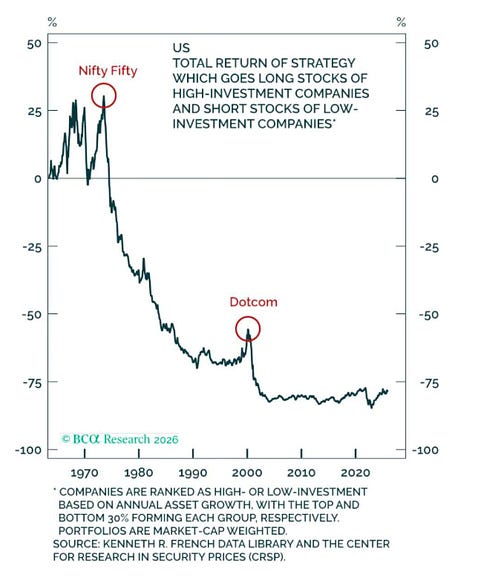
And they’re turning the bond markets to finance the great AI Buildout All while the U.S. government has to refinance almost $9.6 trillion in debt… which creates significant challenges for broader refinancing. A lot of these companies saved balance sheet capacity for moments like this… But the timing is tricky…. Chart 5: It May Not TakeSo… is this time different when it comes to high-investment companies… I’ve been doing a lot of research on the Johnson-Nixon Era in recent days, and I’m reminded of the outrageous valuation expansion that happened during the Nifty Fifty Days. Back then, the argument went that these companies could increase earnings faster than their return on equity, leading to the theory of infinite value.
The valuations of these stocks surged… some going over 100x. That led Abraham Levitt, a real estate mogul, to reportedly say,
That’s a fine way of saying… “What were you thinking?” During the Dot-Com Era, the buildout was significant, and price-to-revenue became the scary metric. That’s where the CEO of Sun Microsystems warned about the insanity of a stock trading at 10 times revenue on a fundamental basis.
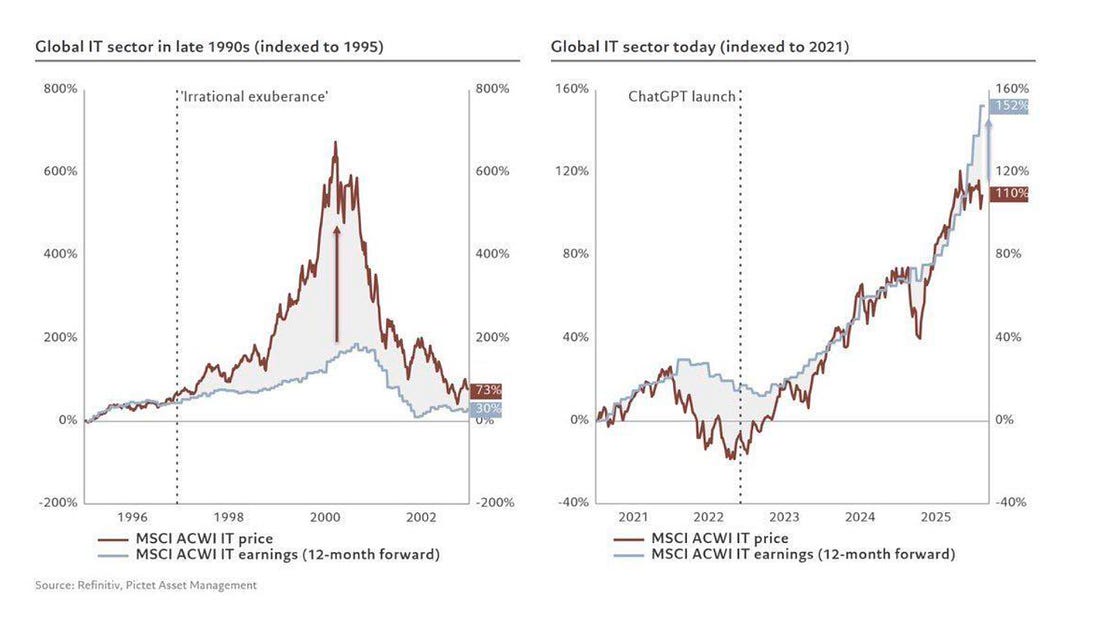
Now… here we are again… in a stretched valuation environment… with massive investments… all while opportunities exist in capital-light businesses. Is this time different? Chart 6: But…On the other side, however, here’s Steve Donzé… There’s a big difference between the Dot-Com Bubble and the AI Buildout
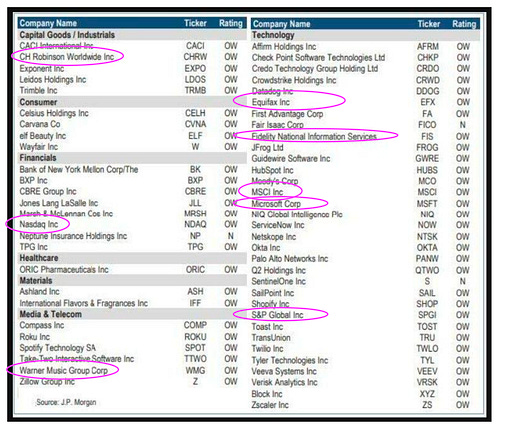
Chart 7: Remember…Lots of chatter around this chart… that’s JPMorgan's list of stocks it views as opportunities in the wake of the software selloff. In this list, JPM suggested that many of these names had overshot their fundamentals… Great…
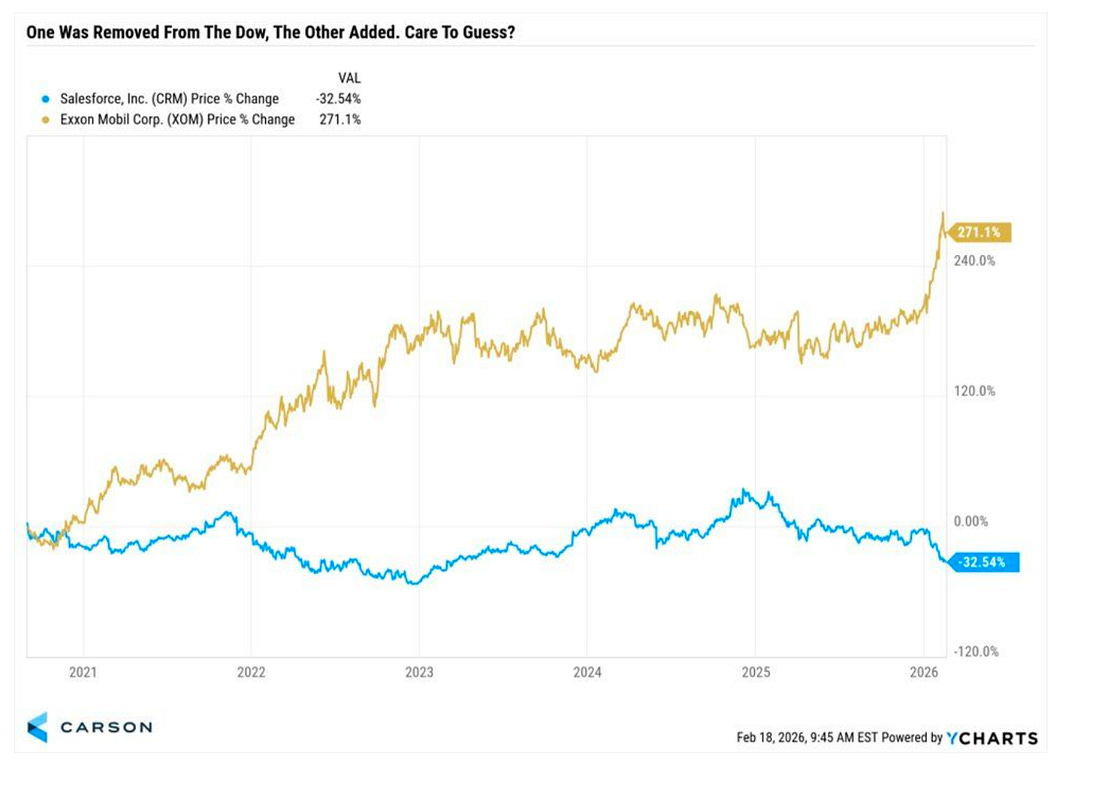
Here’s the issue. If they’re so cheap, why aren’t a lot of CEOs, CFOs, and other insiders buying these stocks? The pink circles are the only stocks to see serious insider buying since December… And if they’re not buying… jake sure you know why you are. Chart 8: The More Things ChangeHere’s Exxon Mobil’s (XOM) stock performance against the company that replaced it in the Dow Jones in August 2020… That’s Salesforce.com (CRM).
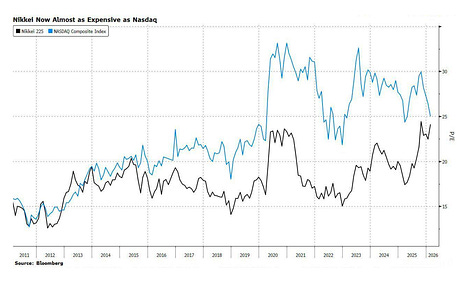
But do go on about how Salesforce is environmentally friendly or something… and that’s good for pension funds and endowments. Chart 9: It’s Almost Like They’re Printing MoneyThe Nikkei’s PE ratio is about to align with the Nasdaq…
I wonder if money printing, cross-border flows, and demographics have anything to do with it? Chart 10: The Winter Olympics End Well… another year… and another time that I skipped the Winter Olympics… I have to remember this moment today… with the U.S. winning hockey. I wouldn’t have attended this morning’s game… I’d have gone Friday night and flown home yesterday.
But… I feel like I have to go to the French Alps in four years for my own sanity… The Winter Olympics are sorely underrated… And if you need proof… I leave you with this picture… This should soon be ranked as the greatest save in the history of U.S. national sports…
U.S. goalie Connor Hellebuyck had a game for the ages. But when I saw this image after the game ended, the first thing I thought of was Gordon Banks' save on Pelé in the group stage of the 1970 World Cup. But this save came in the Olympic Gold Medal Game, keeping it tied and helping force the game into overtime… It’s a stunning reminder why there is no better responsibility in any sport (and even in finance) than minding the net… Stay positive, Garrett Baldwin About Me and the Money Printer Me and the Money Printer is a daily publication covering the financial markets through three critical equations. We track liquidity (money in the financial system), momentum (where money is moving in the system), and insider buying (where Smart Money at companies is moving their money). Combining these elements with a deep understanding of central banking and how the global system works has allowed us to navigate financial cycles and boost our probability of success as investors and traders. This insight is based on roughly 17 years of intensive academic work at four universities, extensive collaboration with market experts, and the joy of trial and error in research. You can take a free look at our worldview and thesis right here. Disclaimer Nothing in this email should be considered personalized financial advice. While we may answer your general customer questions, we are not licensed under securities laws to guide your investment situation. Do not consider any communication between you and Florida Republic employees as financial advice. The communication in this letter is for information and educational purposes unless otherwise strictly worded as a recommendation. Model portfolios are tracked to showcase a variety of academic, fundamental, and technical tools, and insight is provided to help readers gain knowledge and experience. Readers should not trade if they cannot handle a loss and should not trade more than they can afford to lose. There are large amounts of risk in the equity markets. Consider consulting with a professional before making decisions with your money.
|


Subscribe to:
Post Comments (Atom)
0 Response to "Give Me Liberty... and Give Me Charts..."
Post a Comment