
Hey trader,
Something fishy is going on in the oil markets.
And it's creating an interesting opportunity that you probably didn't notice.
Oil futures contracts point to near-term volatility as do the option prices on the USO, the ETF that tracks oil.
Both signals are pointing in the same direction at the same time.
That doesn't happen often. When it does, it's worth paying attention.
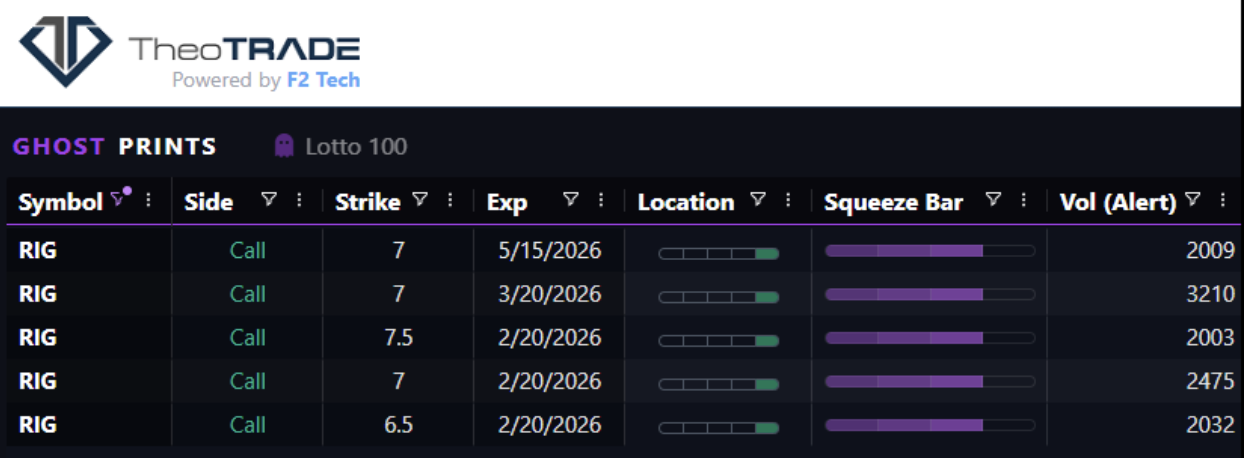
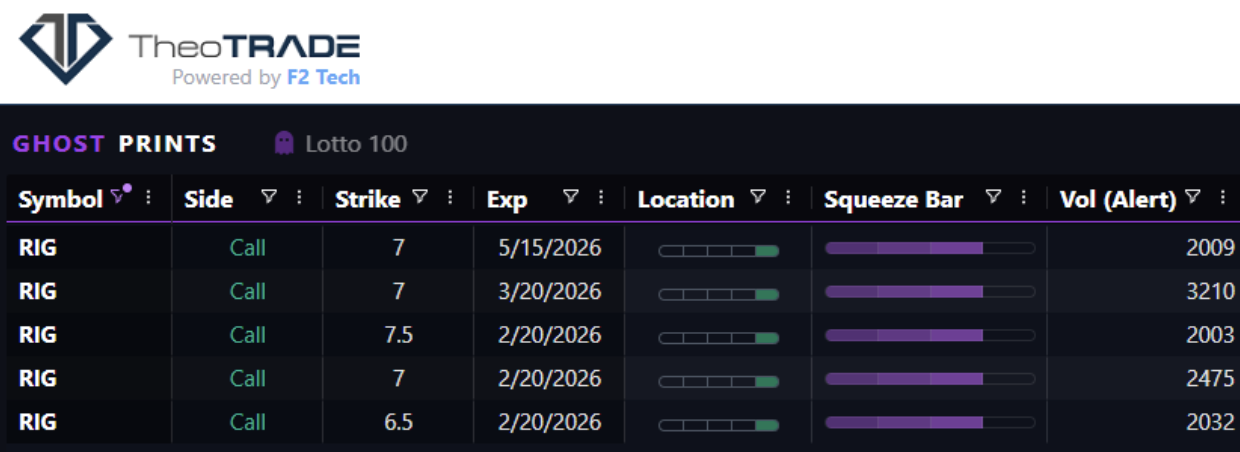
On top of that, the Ghost Prints Console flagged massive call buying in the oil name RIG last week:
Most traders track oil by watching the price of a barrel. That number tells you where oil is today.
It tells you almost nothing about where it's going.
The futures curve and the options market are different. They show you how institutional money is actually positioned.
Right now, both markets are pricing in more upside risk than downside risk in oil.
Here's exactly what that means and how to trade around it.
Start With the Futures Curve
An oil futures contract is an agreement to buy oil at a set price on a future date. There are contracts for next month, three months out, six months out, and beyond.
Line up all those prices and you get the futures curve. The shape of that curve tells you how the market expects supply and demand to behave over time.
Normal conditions produce an upward slope. Near-term oil is cheaper, and oil further out costs more. That makes sense because storage, financing, and time all add cost.
When the curve flips, that condition is called backwardation:
- Near-term oil is priced higher than oil delivered months from now
- That urgency reflects a real or anticipated shortage in supply
- Buyers are willing to pay a premium to secure oil today
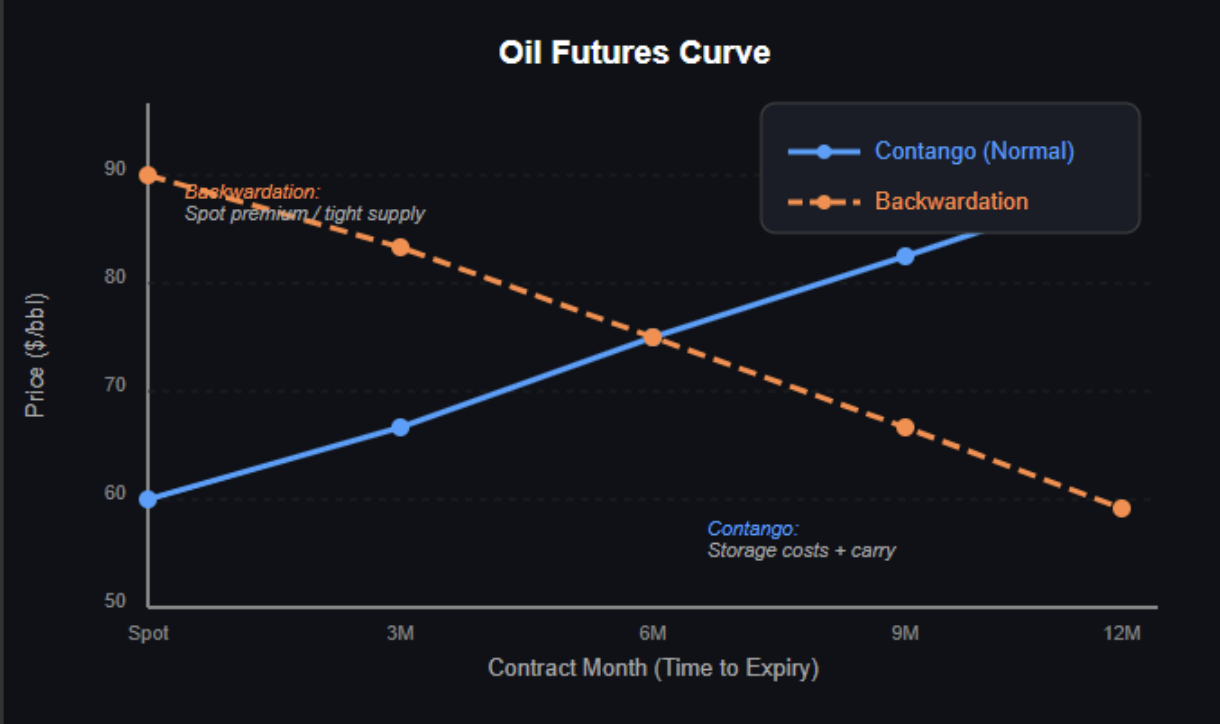
The oil curve has been in backwardation since at least January 20. The slope was steepest then and has flattened modestly since, but the structure remains intact today.
What Backwardation Actually Measures
There's a calculation embedded in backwardation called the net cost of carry. Plain terms:
- You buy oil, store it, and finance the purchase. Those are costs.
- You can also lease out the oil you're holding. That's income.
- The net cost of carry is costs minus income.
When that number is positive, the futures market is saying the income from holding oil right now outweighs the cost of holding it. That reflects genuine demand pressure at current prices.
Oil is sitting in that condition today.
Then Look at the Options Market
The futures curve shows institutional expectations. The options market in USO shows how traders are paying to position themselves.
Every option carries implied volatility. That's the market's estimate of how much the underlying will move. Higher implied volatility means higher option prices.
In most stock markets, puts carry higher implied volatility than calls. Investors buy puts heavily for downside protection, which drives put prices up.
Oil doesn't follow that pattern. Oil tends to spike violently upward during supply shocks. The crash risk in oil runs to the upside.
Right now in USO:
- Call implied volatility is higher than put implied volatility
- Call volatility is rising
- Put volatility is falling
That's called positive skew. Traders are buying calls and selling puts. The options market is pricing in the same thing the futures curve shows: more upside risk than downside risk.
Why Positive Skew Makes Call Spreads Cheaper
When call implied volatility is elevated, the call you sell in a vertical spread carries more premium than it normally would. That extra premium collected on the short leg reduces the net cost of the spread.
A call spread in USO near the $79/$81 range currently costs less than it would in a neutral skew environment. The options market is subsidizing the bullish trade because it's already pricing in upside risk.
What Ghost Prints Is Seeing in Energy
The Ghost Prints Surveillance Console flagged a bullish prints in RIG on February 13, before the stock broke out.
Energy stocks tend to price in oil's direction before the commodity itself moves. Producers, servicers, and refiners all benefit when oil prices stay elevated, and margin improvement shows up in earnings first.
Oil doesn't need to push to new highs for this to work. It just needs to stay where it is. At current prices, most producers are running near multi-month-high margins. That translates into continued earnings beats across the supply chain:
- Producers like RIG benefit from sustained drill rates
- Integrated names like Exxon benefit from stable crude prices
- Refiners like Valero pass higher input costs through to consumers at the pump
The Exxon Setup
Exxon has pulled back and is forming a bull flag. The Fibonacci projection from the current structure targets the $163 to $165 range.
Two ways to structure exposure:
Call Spread (Defined Risk)
- Buy March $155 call, sell March $160 call
- Cost: approximately $1.36 debit
- Target exit: $2.50 if Exxon pushes toward $157 to $160
- Return: approximately 100% on the debit paid
Cash-Secured Put (Income)
- Sell March $150 put
- Premium collected: approximately $4.75 at the midpoint
- That's roughly 3% on a $150 stock for one month
- Breakeven sits at $145.35, which aligns with Exxon's recent price low
Note: Exxon's implied volatility is currently at 31%. The put-selling structure works best above 35%. If volatility rises as the energy trade develops, the premium collected improves.
Two Signals, One Direction
The oil futures curve has been in backwardation since January. USO options are showing positive skew with call volatility elevated and rising.
Two independent markets are telling the same directional story. That's the signal worth trading around.
The Ghost Prints Console identified the RIG entry before the breakout and continues to track flow across the energy complex in real time. The futures curve and options skew give you the macro context. The Console shows you where institutional money is actually moving inside that context.
Brandon Chapman, CMT
Creator of Ghost Prints
Disclaimer: Neither TheoTrade or any of its officers, directors, employees, other personnel, representatives, agents or independent contractors is, in such capacities, a licensed financial adviser, registered investment adviser, registered broker-dealer or FINRA|SIPC|NFA-member firm. TheoTrade does not provide investment or financial advice or make investment recommendations. TheoTrade is not in the business of transacting trades, nor does TheoTrade agree to direct your brokerage accounts or give trading advice tailored to your particular situation. Nothing contained in our content constitutes a solicitation, recommendation, promotion, or endorsement of any particular security, other investment product, transaction or investment.Trading Futures, Options on Futures, and retail off-exchange foreign currency transactions involves substantial risk of loss and is not suitable for all investors. You should carefully consider whether trading is suitable for you in light of your circumstances, knowledge, and financial resources. You may lose all or more of your initial investment. Opinions, market data, and recommendations are subject to change at any time. Past Performance is not necessarily indicative of future results.
0 Response to "The Oil Trade No One is Watching"
Post a Comment