CPI data comes in as expected… unfortunately, it’s already outdated… aluminum is jumping… how to play it… Alcoa looks like it’s headed for a breakout VIEW IN BROWSER This morning, the latest Consumer Price Index (CPI) numbers came in as expected. Headline inflation increased 0.3% for the month and 2.4% on the year – both numbers matched consensus forecasts. Meanwhile, core CPI (which strips out volatile food and energy prices) edged 0.2% higher on the month and 2.5% over the last year. These numbers were also in line with estimates. One noteworthy part of the report came from the shelter component, the CPI’s largest weighting… For years, stubbornly high shelter prices put upward pressure on the overall inflation reading. But this morning, this component came in at 0.2% on a month-over-month basis. And within it, rent costs rose just 0.1% - the smallest monthly increase since January of 2021. But the main headline from this morning’s report? These numbers don’t matter. Under normal circumstances, today’s CPI figures would be exactly what investors want to see – more confirmation that inflation is gradually easing and the Federal Reserve can inch closer to cutting interest rates. But the data reflect the economy that existed before the oil shock triggered by the Iran war. So, while the numbers were largely good, they’re already outdated. The biggest variable in the inflation outlook today isn’t rent, eggs, or deodorant… It’s oil. As you know, the Iran conflict triggered a sudden spike in crude prices, briefly sending oil soaring to roughly $115 per barrel on Sunday evening at the height of the panic. Since then, prices have pulled back sharply, falling into the upper-$80s as I write on Wednesday at lunch. That drop is resulting in many investors breathing a sigh of relief – the assumption being that the worst of the inflation scare is already behind us. But while that drop from $115 to $87 grabs the headlines and is somewhat comforting, is it the right focal point for investors? Wouldn’t the more relevant comparison be current prices to where oil traded before the conflict erupted? Over the week before U.S. strikes on Iran – February 21–27 – the average price of West Texas Intermediate Crude (WTIC) was just over $65 a barrel. That means today’s WTIC price is 34% higher than it was two weeks ago. The key question today is whether oil settles back toward its earlier range or becomes entrenched at higher levels. This morning, the International Energy Agency (IEA) agreed to release 400 million barrels of oil – its largest release ever – to smooth the disruption caused by the war in the Middle East. From IEA Executive Director Fatih Birol: The oil market challenges we are facing are unprecedented in scale, therefore I am very glad that IEA Member countries have responded with an emergency collective action of unprecedented size. Will it be enough to bring WTIC prices back into the $60s? The answer will matter far more for the inflation outlook than anything in this morning’s CPI report. We’ll keep tracking this. Oil isn’t the only commodity reacting to the war Another key industrial metal quietly surged last week as supply fears rippled through global markets – aluminum. As our global macro investing expert Eric Fry, editor of Fry’s Investment Report, recently noted, the conflict in the Persian Gulf has sent aluminum prices surging nearly 10%, pushing the metal to a three-year high. 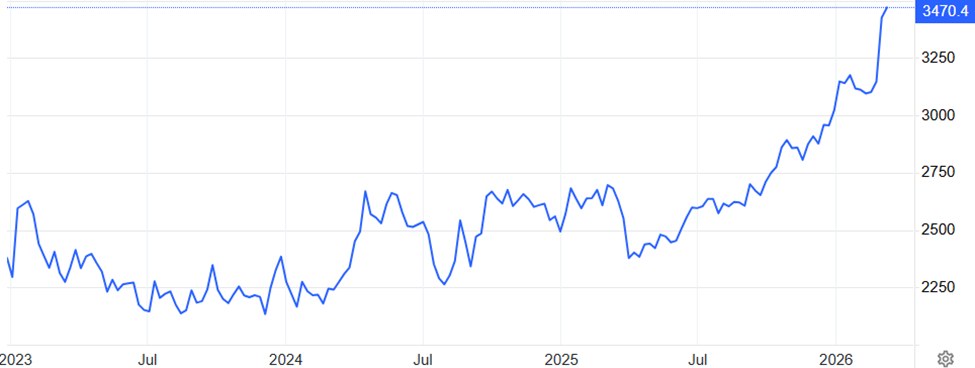
Source: TradingEconomics The Middle East supplies roughly 9% of the world’s aluminum, meaning any disruption to shipments can quickly ripple through global supply chains. But volatility can create an opportunity for investors. Plus, even if tensions cool, aluminum still enjoys a powerful structural tailwind. Here’s Eric explaining: If the war continues to create a global aluminum shortage, mining companies could stand to benefit… And beyond the escalating conflict, aluminum demand has increased thanks to AI’s need for infrastructure and hardware… Every high-voltage line that feeds an AI data hub consumes 1 to 2 tons of aluminum per megawatt of delivered power. Each new stretch of long-distance transmission deepens the world’s appetite for this versatile metal. From 104 million tons of demand in 2024 to an estimated 120 million by 2030, global aluminum consumption is set to grow relentlessly. This lines up perfectly with a theme we’ve been highlighting in recent Digests – investing in the “physical backbone” of AI. Even if the AI trade runs into headwinds, AI itself isn’t going away. Some software platforms and high-multiple application stocks may struggle, but the infrastructure powering AI will remain essential. This means datacenters, advanced semiconductors, power generation, and rare earths and critical minerals/metals – like aluminum – remain mission-critical. So, how do you invest? Eric just highlighted Alcoa (AA), the largest U.S.-based aluminum producer. His Investment Report subscribers are up 71% in this position, but as AI demand increases, that return is likely to keep climbing. Back to Eric: After suffering a tariff-induced selloff earlier in the year, Alcoa’s shares have been trending higher. I expect that uptrend to gain momentum – driven not only by firmer aluminum prices, but also by the company’s exceptional fundamentals… In the end, the market may reward not those who build the virtual world, but those who power it. The AI Revolution will always need its dreamers, but it will depend on the miners that turn metal into its bones. Now, while Eric just outlined the fundamental case for owning AA, traders should watch AA’s developing technical setup… Is AA about to resume its breakout? In the AA chart below, I overlay a stage-analysis framework. Stage analysis is a classic trading approach popularized by legendary technician Stan Weinstein and frequently used by our hypergrowth expert Luke Lango. Notice how AA spent much of the past year in a classic Stage-2 advance. But here in 2026, it’s transitioned into Stage 3 – a pause where buyers and sellers battle to determine the next major move. 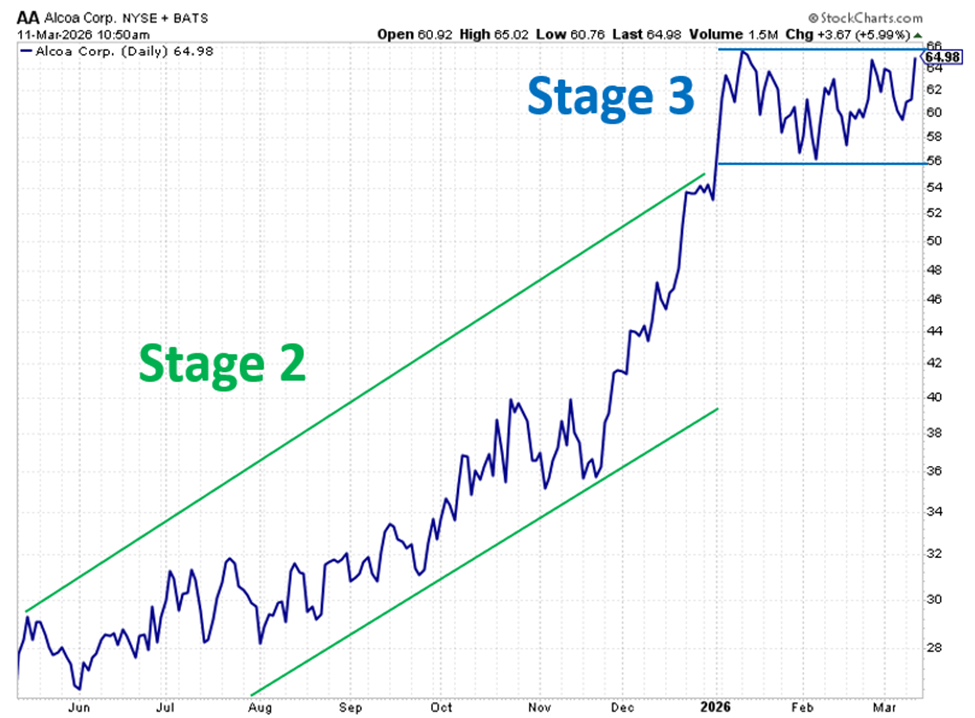
To make sure we’re all on the same page, stage analysis simply breaks every stock’s life cycle into four phases: - Stage 1: A bottoming period where prices move sideways
- Stage 2: A sustained advance driven by heavy buying pressure
- Stage 3: A topping pattern where momentum fades
- Stage 4: A decline as sellers take control
The biggest gains occur during Stage 2, when a stock breaks out of a base and begins trending higher for months – sometimes years. This is exactly what Alcoa did last year. After volatile basing in 2023 and 2024, AA finally broke out in 2025, with its gains accelerating last fall. That advance carried the stock all the way into the mid-$60s earlier this year, where it has since been consolidating in Stage 3. Now, as I noted earlier, in this stage, buyers and sellers battle for where the stock goes next. So, traders need to watch price action and volume closely to make sure they avoid buying in as AA slips into Stage 4. However, given Eric’s macro analysis, we believe the fundamental winds are far more likely to push AA back into Stage 2. This leaves the technicals as the potential starting gun for the next leg higher. Specifically, if Alcoa breaks convincingly above its recent trading range (around $66) on heavy volume – roughly two to three times normal levels – that would signal Stage-2 momentum is likely returning. And that’s a breakout to consider buying. Stage analysis is about letting price reveal what’s happening in real time If AA pushes higher, the chart will confirm it… If it breaks lower, price will tell that story just as clearly… This focus on price action sits at the core of Luke’s stage-analysis trading approach. The challenge is that spotting these Stage-2 breakouts consistently isn’t easy. Thousands of stocks are trading at any given moment, and only a small fraction are setting up for the kind of moves traders want to capture. That’s why Luke and his team built a system designed specifically to scan the market for the best opportunities. Here he is explaining how it works: Identifying true Stage 2 breakouts across thousands of stocks before they move requires serious analytical horsepower. That’s why my team and I have built a system that quantifies the stage analysis framework into a proprietary scoring model – grading thousands of stocks in the market from 0 to 5 based on the strength of their momentum setup. In back-testing, it flagged eight of 2025’s top-performing stocks before their big runs, including: - Hycroft Mining Holding Corp. (HYMC) before a 1,100% move.
- Terns Pharmaceuticals Inc. (TERN) before an 865% surge.
- MP Materials Corp. (MP) months before the Pentagon deal and a partnership with Apple Inc. (AAPL) sent it to the moon.
Right now, several AI-infrastructure stocks – including companies tied to metals, power, and semiconductors – are flashing breakout signals. If you’d like to see more about how the system works – as well as a free stock that’s currently soaring in Stage 2 – you can watch Luke’s free presentation right here. Back to Luke: The system doesn’t chase headlines. It looks for one thing. Stocks on the verge of entering Stage 2. In a market driven by algorithms and geopolitical shocks, reading price structure instead of predicting headlines isn’t optional – it’s essential. We’ll keep tracking all these stories – and the related price action – here in the Digest. Have a good evening, Jeff Remsburg | 


0 Response to "Good CPI Numbers…Are Irrelevant"
Post a Comment