The Market Has Been Selling Everything. This Stock Has Been Quietly Building a Base.

Trade of the Day Wake-Up Watchlist

"A stock that absorbs a bad earnings miss, holds its lows, builds a base, stacks its EMAs, and compresses into a squeeze is telling me something the news feed is not."

Nate Bear, Lead Technical Tactician, Monument Traders Alliance

Nate Bear

The market has been selling everything. AirBnB (ABNB) has been quietly building a base.

I have been trading since 2008. I blew up my first account. Then I blew up a second one.

What I eventually figured out had nothing to do with finding better stocks.

It was about waiting for the right moment to pull the trigger. The system I built around that discipline turned $37,000 into $2.7 million.

Every trade starts the same way. I do not enter until the setup is ready.

Right now, the ABNB setup is getting ready.

The Chart

ABNB is forming a symmetrical triangle on the daily chart. A symmetrical triangle is when price makes a series of lower highs and higher lows, squeezing into a tighter and tighter range. Think of a coil being compressed from both sides.

The longer it compresses, the harder it tends to release.

The EMAs are stacked on the daily time frame. EMAs, or exponential moving averages, track the average price of a stock over a set period, weighted toward recent prices. The EMA 8 is at $131.38, and the EMA 20 is at $130.82, with the shorter above the longer.

Buyers have been consistently stepping in at higher prices in the near term. That is a positive daily trend even though the stock is flat on the year.

The 200-day SMA sits at $128.45. The 200-day SMA is the long-term trend line most serious money uses as a floor, the level where buyers tend to step in and defend a position. Price is trading well above it. The long-term structure is intact.

RSI is at 54.71. The Relative Strength Index measures momentum on a scale of 0 to 100. Above 70 means overbought. Below 30 means oversold. At 54.71, ABNB has real room to run.

And there is a daily squeeze. Bollinger Bands are contracting inside Keltner Channels. Bollinger Bands measure how wide or tight a stock's price range is. Keltner Channels measure the average trading range over time.

When the bands tighten inside the channels, volatility is compressed. The tape is loaded.

ABNB chart
 

SPONSORED

Media Won’t Report This 40% Market Crash Prediction

MoneyGPT
 

Former CIA insider, Jim Rickards warns of a market implosion that could hit any day now..

Learn how to safeguard your money from this threat before it's too late.

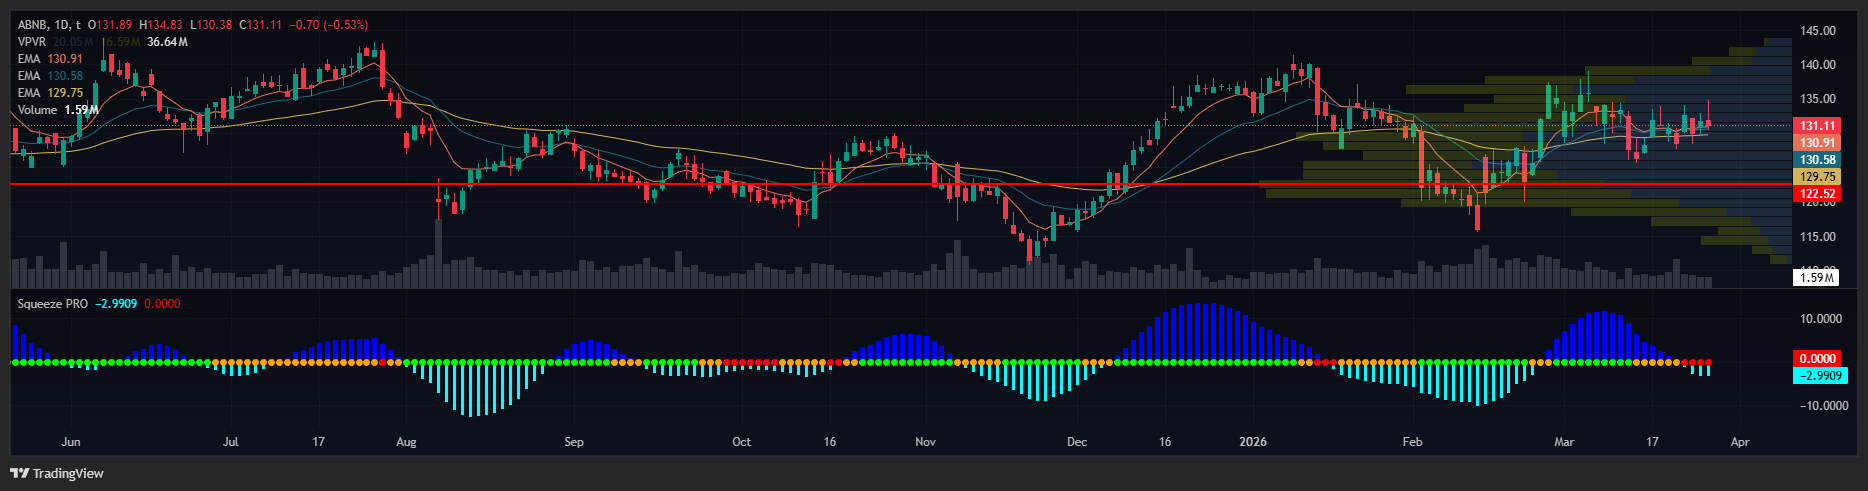
The Business Behind the Chart

In February, Airbnb reported Q4 2025 earnings. The stock was trading around $120 going into the report. EPS missed at $0.56 versus $0.66 expected. EPS, or earnings per share, is the company's profit divided by the total number of shares - the number analysts use to measure whether a company is growing.

The crowd focused on the miss and walked away.

Fools.

Revenue came in at $2.78 billion, up 12% year over year and above guidance. Gross booking value hit $20.4 billion, up 16%.

Gross booking value is the total dollar value of all reservations made on the platform before any refunds or cancellations - the best measure of raw demand.

That 16% was the strongest growth quarter in over two years. Nights booked rose 10%. Management guided Q1 2026 revenue growth of 14 to 16% and expects full-year 2026 growth to accelerate to at least low double digits.

The stock absorbed the miss, held the lows, and has been building a base ever since. It is now trading around $133. That kind of resilience after a miss tells me something.

Next earnings are around May 7. Six weeks out. If this setup fires before then, a catalyst is coming that could amplify the move.

I want to be straight about one thing. ABNB does not have relative strength on the year. It is flat while the broader market has been volatile. That is a fair objection.

But I do not trade the headlines. I trade the setup. Oil at $94. VIX at 28. War headlines every morning. I know what is out there.

What I also know is that a stock that absorbs a bad earnings miss, holds its lows, builds a base, stacks its EMAs, and compresses into a squeeze is telling me something the news feed is not.

When the macro is loud, and a stock is quietly holding structure, that is when I pay attention.

Your Action Plan

I want a clean daily close above the upper trendline of the triangle, converging around $135-$136. If price breaks out on volume with the squeeze releasing, that fires my entry.

The target from there is a move toward the recent highs in the $140 to $145 range.

What would change my read is a clean daily close below the 200 SMA at $128.45. Structure breaks, setup is off the table.

Join me every morning in Daily Profits Live. When ABNB fires, you will know the second I do.

Want more content like this?
Like button Dislike button

SPONSORED

Get Pre-IPO Exposure to ChatGPT (Free Ticker Revealed)

IPO
 

Act BEFORE IPO Announcement as Early as March 18!

Click Here for Details!

Subscribe to receive free email updates:

0 Response to "The Market Has Been Selling Everything. This Stock Has Been Quietly Building a Base."

Post a Comment