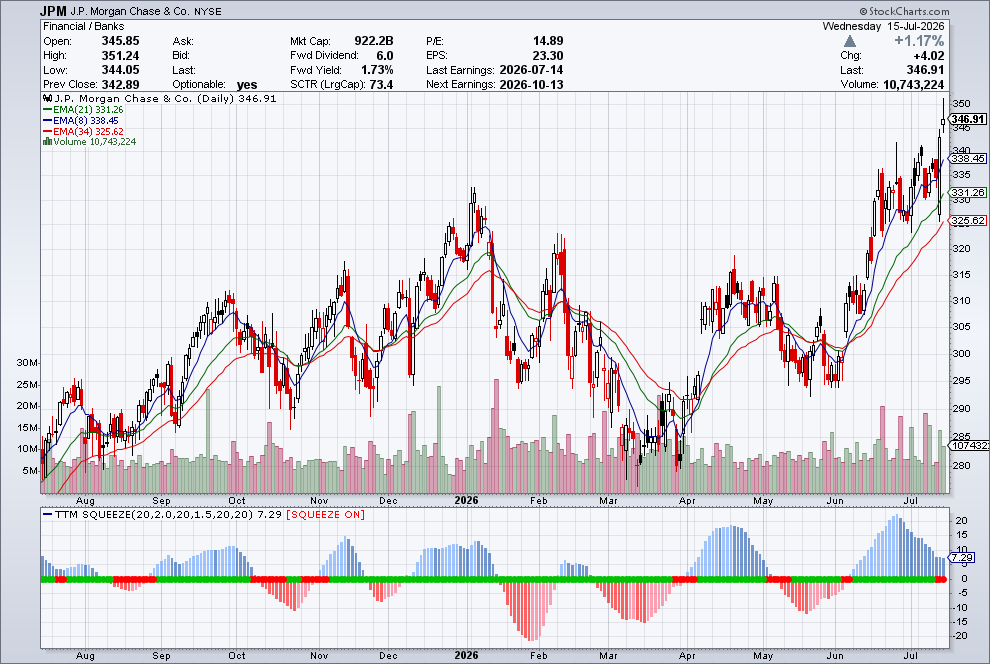
Then July showed up, and it went straight through the top to all-time highs. That is a base breaking. Ten months of supply sitting overhead, every seller who wanted out at 335 finally cleared, and now there is nothing above it. Price closed at 346.91 with the 8 EMA at 338.45, the 21 at 331.26, and the 34 at 325.62. Stacked in order, all three sloping up, price sitting above every one of them on the daily and the weekly both. Trend and pattern, right there. And underneath it, the squeeze is still on. Momentum is already building to the upside, and the thing has not fired yet. Usually, when a stock rips out of a ten-month range, the squeeze has already released, and you missed it, but this one broke out with the squeeze still loaded. The relative strength is where it gets interesting. JPM lagged the S&P 500 all year and lagged its own bank index too, and its technical rank now sits at 73 out of 100 against large caps. That is the number of a leader, not a laggard. Relative strength that spends ten months in the dirt and then turns up while price clears a decade's worth of supply is the exact thing I hunt for. The stock did not lead this market, and now it is starting to. The timing is the other half of it. The catalyst already happened. On July 14 the bank posted the highest profit in the history of American banking, $21.2 billion, on revenue of $58 billion. The stock broke to a record on it. And JPM does not report again until October 13. So there is no earnings landmine between here and October. What there is instead is post-earnings drift, which is the tendency of a stock that gaps on a real beat to keep grinding higher for weeks afterward while the market slowly finishes repricing it. Big institutions cannot buy a $900 billion company in an afternoon, so they accumulate it over sessions, and that steady bid is the drift. Now put that next to a squeeze that has not fired. Drift supplies weeks of patient buying pressure, and the squeeze is the coiled energy waiting on exactly that kind of pressure to release it. That combination, on a base that just broke, with no earnings risk for three months, is a cleaner runway than most setups ever get. The fundamentals hold up, too, and that matters because I want the story pointing the same way as the tape. Yes, $5.6 billion of that profit was one-time gains, mostly from Visa shares. Strip them, and the bank still earned $16.9 billion and still beat. Net interest income rose 10% to $25.5 billion, and management raised full-year guidance on it. Card write-offs came in lower than they guided in April. Then Jamie Dimon got on the call and said it is getting close to as good as it gets. He listed the risks himself. Wars, sticky inflation, asset prices too high. I am not going to argue with him. The man has run this bank for twenty years. But he is talking about years, and I am looking at weeks, and the tape in front of me says a ten-month base just broke on record earnings with a squeeze still coiled underneath it. And it is still cheap while all of this happens, trading at 14.63 times forward earnings while the market pays north of 20 for the average large cap. A record quarter and an all-time high usually cost you more than that. Your Action PlanNo position yet, and I want to see it hold above that old 335 ceiling on any pullback before I do anything. Break back under and the base failed, and I am out of the way. Trend, pattern, and squeeze are all lined up here, on a chart that spent ten months building the exact wall it just cleared. If you want to see what else I’m watching and how I’m trading, check this out. |








0 Response to "It’s About To Join Tesla, Meta, and Broadcom"
Post a Comment