You are a free subscriber to Me and the Money Printer. To upgrade to paid and receive the daily Capital Wave Report - which features our Red-Green market signals, subscribe here.
Dear Fellow Traveler: In my limited time today… I’m doing something… proactive. I’m trying to wrap Christmas presents now… so I don’t have to do it last minute… That distraction today put me behind… so I will keep today’s conversation short… There’s a chart from Barclays making the rounds that should put an end to a decade of fake arguments about what actually drives markets.
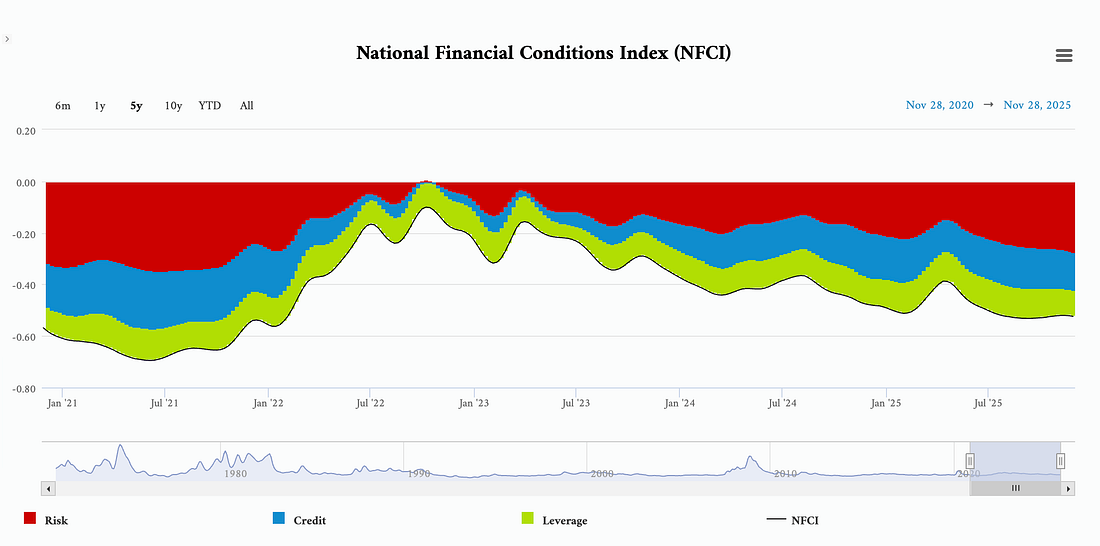
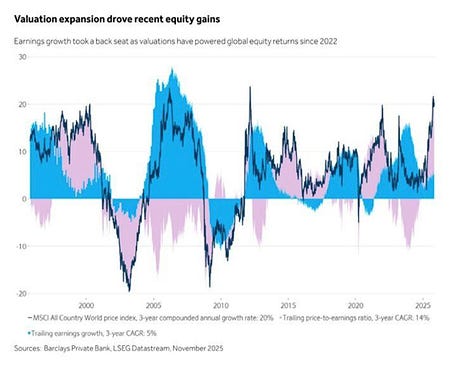
It shows global equities (MSCI ACWI) compounding at roughly 20% annually over the last three years… while earnings grew barely 5%. The rest, nearly three-quarters of total return, came from one thing… valuation expansion. In other words, multiples rose because liquidity increased. Full stop. End of mystery… This is the core of Me and the Money Printer. This chart makes the point more clearly than any FOMC minutes, Wall Street narrative, or CNBC “earnings season” segment ever will. For two years, we’ve been living through a stealth liquidity boom. People keep saying that the Fed was tightening… the Fed was tightening.. and yet, our financial conditions are incredibly loose…
It wasn’t QE or fiscal stimulus that drove these gains… There weren’t magical productivity miracles. The RRP runoff, bill-heavy issuance that released bank balance-sheet capacity, fading QT, and a global bid for U.S. collateral that lowered funding stress. When real liquidity rises faster than the real economy can absorb it, that excess doesn’t magically disappear. It flows into financial assets. And when money floods the pipes, stocks don’t wait for earnings. Multiples move first. Thesis Confirmed…The chart shows that in real time.
The purple “valuation expansion” waves line up almost perfectly with periods of liquidity growth. In 2010–2012, when QE reloaded the system, multiples ripped higher while earnings sagged. In 2017, when tax changes and liquidity inflows overlapped, valuations expanded even as global growth softened. And from 2022 to 2025, we saw the same pattern… stable earnings with valuations doing all the heavy lifting. This is why traditional investors get blindsided. They’re taught that earnings drive long-term returns. And in a vacuum, that’s true. But we don’t live in a vacuum. We live inside a financial system that constantly adjusts liquidity to prevent funding stress, and asset prices respond instantly to those adjustments. The real economy crawls... while liquidity sprints. The chart also shows the danger. Every time valuation expansion outruns fundamentals, it eventually snaps back when liquidity tightens. Every time. Multiples aren’t immune to gravity… They’re temporarily immune from the tide beneath them. When the tide goes out (QT, reserve scarcity, collateral shortages, widening SOFR spreads), the purple bars shrink, and markets suddenly “rediscover” that earnings matter. But that’s the wrong lesson. Earnings don’t suddenly regain importance… Liquidity stops hiding those companies’ limitations. What To Do…If you don’t track liquidity, you’re trading blind. This chart confirms that everything since 2022 has been a liquidity-driven rally masquerading as earnings. The liquidity cycle bottomed out on the back of the GILT Crisis in 2022… the Treasury Department became more involved… financial conditions expanded significantly… which helped boost leverage and valuations… But the moment the Money Printer slows (not stops, slows), valuation expansion will stop carrying this market. The film Margin Call does a very good job explaining…
That’s why we follow the pipes. T hat’s why we watch the SOFR spread, reserves, bills vs coupons, RRP, and the TGA. Because earnings tell you where we’ve been. Liquidity tells you where we’re going. And this market is one big front-running operation on liquidity expectations… Get involved with us… Stay positive, Garrett Baldwin About Me and the Money Printer Me and the Money Printer is a daily publication covering the financial markets through three critical equations. We track liquidity (money in the financial system), momentum (where money is moving in the system), and insider buying (where Smart Money at companies is moving their money). Combining these elements with a deep understanding of central banking and how the global system works has allowed us to navigate financial cycles and boost our probability of success as investors and traders. This insight is based on roughly 17 years of intensive academic work at four universities, extensive collaboration with market experts, and the joy of trial and error in research. You can take a free look at our worldview and thesis right here. Disclaimer Nothing in this email should be considered personalized financial advice. While we may answer your general customer questions, we are not licensed under securities laws to guide your investment situation. Do not consider any communication between you and Florida Republic employees as financial advice. The communication in this letter is for information and educational purposes unless otherwise strictly worded as a recommendation. Model portfolios are tracked to showcase a variety of academic, fundamental, and technical tools, and insight is provided to help readers gain knowledge and experience. Readers should not trade if they cannot handle a loss and should not trade more than they can afford to lose. There are large amounts of risk in the equity markets. Consider consulting with a professional before making decisions with your money.
|


Subscribe to:
Post Comments (Atom)
0 Response to "Thesis Confirmed..."
Post a Comment