Managing Editor’s Note: On Wednesday, January 28, at 8 p.m. ET, tech investing legend Jeff Brown is having a special online strategy session called 24-Hour AI Fortunes, where he will discuss a powerful AI phenomenon that has the potential to transform your life in just 24 hours. In one of these episodes, you could have turned $10k into $150,000 in a single day. Click here to RSVP automatically… An Interest Rate Trainwreck Is Unfolding By Larry Benedict, editor, Trading With Larry Benedict Just when it seemed like the trade war had taken a backseat, the headlines are back. Over the weekend, President Trump announced a new 10% tariff that takes effect in February against several European nations… ones that oppose his desire to acquire Greenland. On June 1, it increases to 25% if there’s no deal for the country. The European Union (EU) is hitting back, threatening to scrap the deal reached with the U.S. following the trade war’s initial round last year. The EU is even threatening to use its “bazooka” option, where it can limit access to the European economy by U.S. companies. With tensions surging, stocks posted their worst single-day drop in months. The S&P 500 declined by 2.1%, which was the largest drop since October. Measures of stock market volatility surged higher. But it’s not the action in the stock market that should be catching your attention. I’ve shown you recently how rumblings in the bond market could impact your entire portfolio. Following the renewed trade tensions, that’s exactly what is playing out… and it could be just the beginning. | Recommended Links
The Next Big AI Application: Buy These Three Stocks Forget self-driving cars, robots, or AI agents. This coming Wednesday, January 28, at 8 p.m. ET… Jeff Brown will tell you about a new AI application so powerful that it has been delivering gains big enough to turn $10,000 into… $101,700… $151,600, and even a mind-blowing $650,000… all in a 24-hour period. Click here to save your seat for this special strategy session he's calling 24-Hour AI Fortunes.
(When you click the link, your email address will automatically be added to Jeff's guest list.)
| Measuring Bond Volatility The term volatility is used to describe the magnitude of price swings. Higher volatility means more and bigger ups and downs. The CBOE Volatility Index (VIX) tracks volatility on the S&P 500. It’s often referred to as Wall Street’s “fear gauge” because it tends to jump when stocks are selling off. On Tuesday, as the S&P 500 dropped, the VIX jumped over 6%. The bond market also has its own volatility measure. The Merrill Lynch Option Volatility Estimate tracks volatility in U.S. Treasury securities. That name is a mouthful, though, so traders refer to it as the MOVE Index. Similar to the VIX, the MOVE Index can see sharp changes in both directions. It shifts in response to volatility in bond prices. And recall that bond prices move inversely to interest rates. When rates are rising, bond prices fall – and vice versa. When rates are grinding sideways or lower, that tends to mark a low-volatility environment for bond prices. That keeps a lid on the MOVE Index. But when rates are rising and bonds are selling off, the MOVE Index tends to spike higher. Longer-term rates have been drifting in a sideways trend since 2023. That’s led to a period of low volatility in bond prices, which has driven the MOVE index toward a historically suppressed level. But now mean reversion is emerging in bond volatility, which has massive implications for investor portfolios. Tune in to Trading With Larry Live 
Each week, Market Wizard Larry Benedict goes live to share his thoughts on what’s impacting the markets. Whether you’re a novice or expert trader, you won’t want to miss Larry’s insights and analysis. Even better, it’s free to watch. Simply visit us on YouTube at 8:30 a.m. ET, Monday through Thursday, to catch the latest. | Bond Market Warnings I often analyze mean reversion in the stock market. I’ll show how a trend that gets stretched too far in one direction can snap back the other way. The same thing can be said about volatility in the bond market. When volatility runs above or below average levels for a prolonged period of time, you should be on the lookout for a snapback in the other direction. For that reason, you should be concerned about the bond market volatility in the MOVE Index chart below. 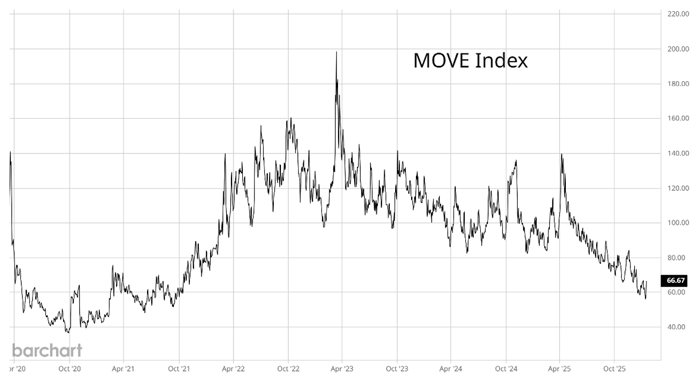
(Click here to expand image) Interest rate volatility is running at low levels and pulled back further following the initial rounds of the trade war last year. That has sent the MOVE Index toward the low end of the historical range. And it could be setting up for a reversal higher. The last time the index turned higher from a low level occurred heading into 2022. That’s when a jump in bond yields happened alongside a 25% bear market in the S&P 500. Of course, I’m not saying that rates must jump higher just because the MOVE Index is low. But you should stay on the lookout for signs of rising bond market volatility. I believe we’re now seeing those signs. Following the resurgence of trade war headlines, the 30-year Treasury yield jumped to its highest level since last summer. That puts it near a crucial level that I showed you here. Treasuries are supposed to be a safe haven, but they sold off along with the stock market following the weekend developments, leaving investor portfolios exposed. That hints at a change in bonds and illustrates why you may want to play your cards cautiously amid rising bond market volatility. Happy Trading, Larry Benedict
Editor, Trading With Larry Benedict Free Trading Resources Have you checked out Larry’s free trading resources on his website? It contains a full trading glossary to help kickstart your trading career – at zero cost to you. Just click here to check it out. | | 


0 Response to "An Interest Rate Trainwreck Is Unfolding"
Post a Comment