Managing Editor’s Note: What if you could compress years of massive stock market gains into a 24-hour period? Sounds crazy, right? But on Wednesday, January 28, at 8 p.m. ET, our colleague Jeff Brown will reveal how a strange phenomenon has been sending a small group of AI stocks exploding higher hundreds or even thousands of percent… all in 24 hours. If you want to learn how he recommends profiting from this phenomenon, then click here to RSVP automatically for his 24-Hour AI Fortunes event. How to Take Advantage of Gold and Silver Running Hot By Larry Benedict, editor, Trading With Larry Benedict Gold and silver have been running hot. Barely a year ago, gold was trading around $2,700 an ounce. This week, it broke through $4,800 – an 80% move. Silver has done even better. After a sluggish start in 2025, it has more than tripled in value over the same period. Countless retail investors have jumped into these assets as a result. Yet you don’t have to trade gold and silver individually to take part in a move. Gold and silver stocks are included in the SPDR S&P Metals and Mining ETF (XME) – an ETF that invests in copper, aluminium, coal, steel, uranium, and other precious metals too… Many of these assets have also been caught up in the commodities rush. But like any move, commodities are in danger of overheating when insatiable buying wanes. That could provide the setup for a mean reversion trade to the downside. So let’s check in on the chart of XME to see how things might play out from here… | Recommended Links
Save Your Seat for Jeff Brown's 24-Hour AI Fortunes During this strategy session (click here to save your seat)… he will reveal a powerful AI phenomenon that has the potential to transform your life in just 24 hours. In one of these episodes, you could have turned $10k into $150,000 in a single day. Most people don't know about it because it affects less than 1% of stocks. But when you join him (click here to RSVP), he will give you all the details and even give away the name of one of these AI stocks… completely free of charge.
(When you click the link, your email address will automatically be added to Jeff’s guest list.)
A Historic Gold Announcement Is About to Rock Wall Street For months, sharp-eyed analysts have watched the quiet buildup behind the scenes. Now, in just days, the floodgates are set to open. The greatest investor of all time is about to validate what Garrett Goggin, Chief Analyst and Founder of Golden Portfolio, has been saying for months: Gold is entering a once-in-a-generation mania. Front-running Buffett has never been more urgent – and four tiny miners could be your ticket to 100x gains. Click here to get Garrett's Top Four picks now >>>
| Mean Reversion Opportunities XME has experienced a big rally in the last year. It bottomed out on April 7 after the “Liberation Day” tariffs meltdown. Then XME went on an almighty tear. By its peak in October, it had gained 142%. But that move pushed XME well into overbought territory. In the chart below, the peak and reversal at “1” coincided with the Relative Strength Index (RSI) reversing sharply from overbought territory at “A.” SPDR S&P Metals and Mining ETF (XME) 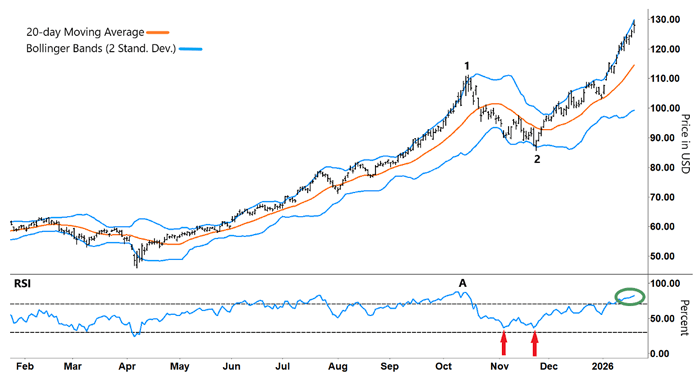
Source: e-Signal (Click here to expand image) XME’s reversal at “1” also came off the upper blue line. Those blue lines in the price chart are Bollinger Bands. They represent two standard deviations of price data (95% of the price action) above and below the orange line, which is a 20-day simple moving average (SMA). When prices start trading near extremes (blue lines), they become more likely to swing back the other way. That feeds into my mean-reversion strategy. Stocks can stretch too far in one direction and grow susceptible to snapping back the other way – just like a rubber band. I look to exploit these moves for profit. After its down move, XME twice rebounded off the lower Bollinger Band, including the low at “2.” That came in conjunction with the RSI forming “Vs” (red arrows) and rallying from oversold territory (lower gray dashed line). From there, XME has rallied sharply, gaining 51% off that November trough in just two months. So, how should we approach any potential trade from here? Tune in to Trading With Larry Live 
Each week, Market Wizard Larry Benedict goes live to share his thoughts on what’s impacting the markets. Whether you’re a novice or expert trader, you won’t want to miss Larry’s insights and analysis. Even better, it’s free to watch. Simply visit us on YouTube at 8:30 a.m. ET, Monday through Thursday, to catch the latest. | Trade Confirmation XME’s rally off “2” has seen it hug the upper Bollinger Band – a common pattern when a stock is rallying sharply. Within that move, XME rebounded off the 20-day SMA (orange line), which can act as a mini support and resistance level within a bigger overall move. That’s another pattern to watch out for in your trading. The chart also shows that the RSI is well into overbought territory (green circle). Take another look: SPDR S&P Metals and Mining ETF (XME) 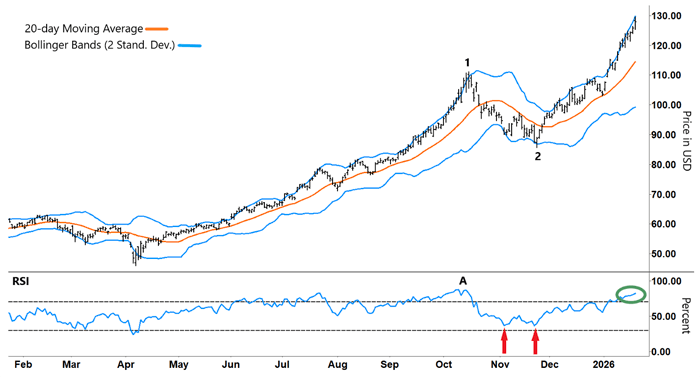
Source: e-Signal (Click here to expand image) That, along with XME tracking along its upper blue line, is not enough to justify a trade by itself. A stock can stay in overbought territory for some time before it pulls back. The same is true for a stock moving along one of the Bollinger Bands. So we need a clearly defined trigger. In this case, we want to see the RSI definitively reverse before considering a short trade. And by combining Bollinger Bands and the RSI, we greatly increased our chances of catching a reversal trade. Happy Trading, Larry Benedict
Editor, Trading With Larry Benedict Free Trading Resources Have you checked out Larry’s free trading resources on his website? It contains a full trading glossary to help kickstart your trading career – at zero cost to you. Just click here to check it out. | | 


0 Response to "How to Take Advantage of Gold and Silver Running Hot"
Post a Comment