You are a free subscriber to Me and the Money Printer. To upgrade to paid and receive the daily Capital Wave Report - which features our Red-Green market signals, subscribe here.
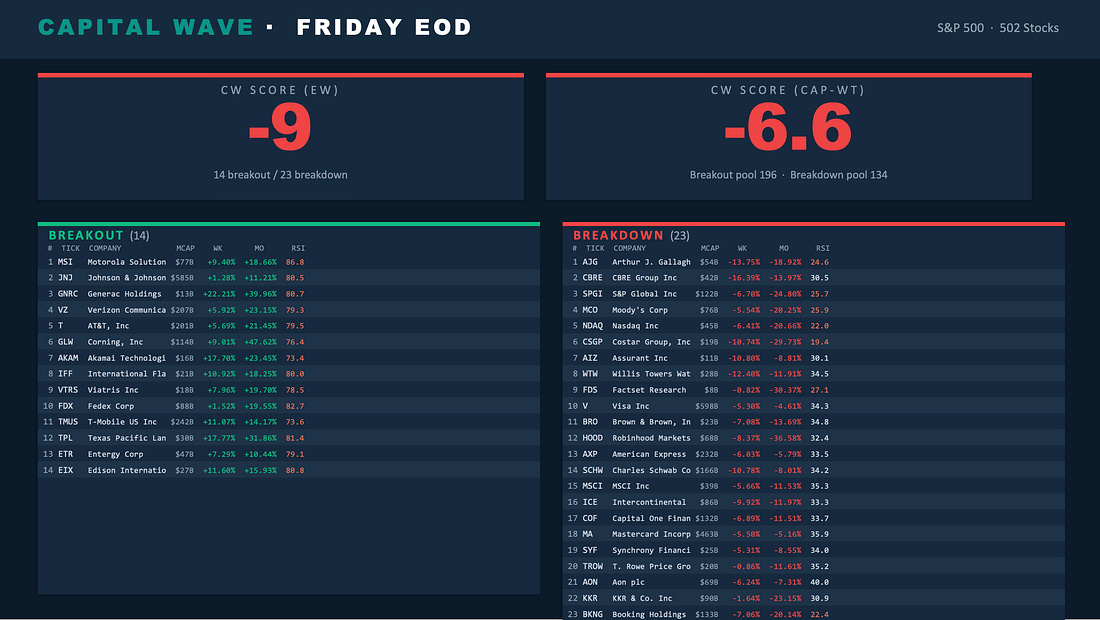
Dear Reader: Five years ago, a math equation changed my life. I was sitting in my office in Bonita Springs, Florida, staring at a spreadsheet that did not make sense. The S&P 500 had just hit record highs. Sentiment was euphoric. Everyone was buying. But a number - the result of the equation - said otherwise. I’d spent months building a scoring system that measured the internal momentum of the S&P 500. It was based on the academic work of multiple momentum experts. But I was adding my own flair to it… This wasn’t the index price, nor the headlines, nor what Jim Cramer was yelling about. It was all happening inside the 500 stocks that make up the index. On February 22, 2020, that number went negative for the first time. What followed was a 34% crash into the fastest bear market in modern history. I’ve been refining that system ever since. My father-in-law, Tim Melvin, helped me recognize the importance of the MACD's rate of change. Various books that we’d discussed by people like Grant Henning, Wes Gray, and Gary Antonnaci helped too. Now, I have my own figure… the Capital Wave Score. And, a screener that tells us the strongest momentum stocks and most negative momentum stocks right now… Yesterday, I pulled a 68% gain shorting BXP (BXP), and today I went after Mastercard (MA). A reader asked me to explain this score… what it does, and what it means. Happy to do so… Because right now, it’s telling a story that most peo’t hearing. What Is a Capital Wave Score?Every trading day, I score the entire S&P 500, all 502 stocks, through a quantitative system I call the Capital Wave Score. The output is one number. A directional score. Today, our score is Minus 9. And our cap-weighted score is Minus 6.6…
Positive means momentum favors the bulls. The guts of the market, not just Apple, Microsoft, and NVIDIA dragging the index around, are trending higher. Negative means the opposite. The majority of stocks are breaking down. Sellers are in control. If that’s the case, the internal machinery of the market is deteriorating, even if the headline index has not yet caught up. That last part is critical. Because in every major market downturn I have studied, COVID, the 2022 bear market, the SVB crisis, the Japan Nikkei implosion, the internal momentum broke down before the index price confirmed it. I have been on air for four years doing this… so go back and check the tape. That gold crash The score caught it. Every time. How Does It Actually Work?I’m not going to give you the full recipe. But I’ll walk you close enough to the kitchen that you can smell what’s cooking. Step 1: Momentum Segmentation Every stock in the S&P 500 gets classified based on its weekly and monthly price momentum. I’m looking for coordinated directional moves across multiple timeframes. If a stock is up solidly for the week and the month, it shows breakout momentum. If it is down on both, it’s in breakdown mode. This is not a single moving average crossover. This is a multi-timeframe filter that separates real trends from noise. Step 2: Sector-Calibrated Scoring Here’s where it gets proprietary. Not every stock should be scored the same way. A utility does not behave like a semiconductor. A healthcare stock does not respond to the same forces as a regional bank. So I built scoring models calibrated to each sector. They weigh relative strength, volatility characteristics, price behavior, and fundamental factors, with unique weightings for eight different sector groups. A high RSI means something different for a tech stock than it does for a utility. The model knows that. Step 3: Volume Conviction Here’s what I have found is so important… Raw scores get adjusted by relative trading volume. This is the conviction filter. When a stock is screaming higher on twice its normal volume, that is institutional money moving. When it is drifting up on thin volume, that is noise. The volume adjustment amplifies real moves and dampens the fakes. Step 4:" The Cap-Weighted Overlay This is the part that kept me up at night for months. Capital Wave runs two independent readings in parallel. The CW Anchor looks at weekly and monthly trends. Anchor is just breakout stocks minus breakdown stocks. And for five years, that figure has done its job. But now we’ve added a weighted side… so the CW figure can be negative, but the weighted number is still pulling the market higher. This is a HUGE warning sign. The underlying parts of the markets are selling… but just a few names are doing the work as institutions crowd into specific names… When that CW figure is negative… and then the weighted cracks lower… Look out below. Think of it as the tide. Remember… The basic score treats every stock equally. Apple gets the same vote as Etsy. But the market does not work that way. Institutions move the mega-caps. Pension funds, sovereign wealth, and the big index flows. They show up in the cap-weighted numbers. So I run this second version of the score where each stock’s contribution is weighted by its market capitalization relative to the average. When the equal-weight score is negative, but the cap-weighted score is still positive, it means the average stock is breaking down, but the mega-caps are holding the line. That’s a warning. It means breadth is deteriorating. The generals are still standing, but the troops are retreating. When does the cap-weighted score also go negative? That is when I pay very close attention. Because it means the big money is leaving, too. Why the Weighting Matters More Than People ThinkLet me explain this with a real example. For weeks, our equal-weight score was negative while the cap-weighted score was positive. The average S&P 500 stock was losing momentum. Sellers were winning across the broad market. But NVIDIA, Apple, Microsoft, the $3 trillion names, were holding firm. And because they make up such a disproportionate share of the index, the S&P 500 looked fine. This is the exact phenomenon that burned people in late 2021. Remember that period? The S&P 500 was hitting all-time highs into early January 2022. The index looked bulletproof. But underneath the surface, hundreds of stocks had already rolled over. The Russell 2000 peaked in November 2021, two months before the S&P. The average stock was already in a bear market before the index confirmed it. Our cap-weighted score would have held positive during that period, propped up by a handful of mega-caps, while the equal-weight score was deteriorating. Then the cap-weighted score broke. And the S&P 500 fell 28% over the next nine months. This is the pattern. It’s the same one that played out in February 2020. The same one that flashed before the SVB crisis. The same one that preceded the Japan sell-off in August 2024. Internal breadth breaks first. Then the heavyweights crack. Then the index follows. And, of course, the FNGD is our friend telling us when leverage is unwinding… The Capital Wave Score is designed to catch each phase of that sequence. The Cautionary TaleI track this number every day. Not because I enjoy spreadsheets at 6 a.m., well, maybe a little, but because every time this number has gone meaningfully negative, bad things have followed.
I’m not saying the score caused any of these events. It did not predict a pandemic or a bank failure. What it did was measure the internal stress already building in the market. Stress that headlines missed, that sentiment surveys ignored, and that networks’ feel-good narratives papered over. By the time the newspapers caught up, the score had already told the story. Look at August 1, 2024. Our signal went negative that day. Four days later… the S&P 500 collapsed because of Japan…
Just saying… What Is It Saying Right Now?The score went negative on January 28… two days later the price of gold and silver collapsed. Then, last week, momentum stocks collapsed. We’ve been a little choppy, but we’re largely tettering on the edge. Markets are being supported by Federal Reserve monetary action, Japan’s stimulus and fiscal policy, and China’s recent stimulus announcement. Without that support, we’d be getting hammered right now… The equal-weight number has been underwater for two weeks. More recently, the cap-weighted score, the institutional signal, broke negative. That means it is not just the small names. It’s not just rotation. The big money is under pressure, too. Now, does that mean the market is about to fall 30%? No. I don’t predict outcomes. I measure conditions and teach people how to hedge and play defense when the market is under pressure... Conditions right now indicate that internal momentum is weak, breadth is deteriorating, and the market is more fragile than the index suggests. The Intraday Pulse has recently flashed some positive readings. Short-term buying pressure is showing up. But the anchor trend, the weekly and monthly structural momentum, has not confirmed a reversal. We are in a divergence. And if five years of tracking this number has taught me anything, it is that divergences resolve themselves. Sometimes violently. What I Do With This InformationDifferent people use this differently. Some traders flip to short-term bearish bets. Some investors sell covered calls on long positions to generate income during choppy periods. Some simply go to cash and wait. Me? I’ve learned that my best trades come from waiting for negative momentum events and then buying the dip after the signal confirms a reversal, insider buying picks up, or we move to oversold conditions as we look for a squeeze. I’ve got a lot of different strategies… and I’m happy to walk you through them… Each strategy requires patience… Patience is not sexy. But it’s solvent. I’ll keep tracking the score. I’ll keep reporting what it tells me. And when the signal turns, when both lenses confirm a bullish reversal, I’ll be ready. And so will you… Stay positive, Garrett Baldwin Capital Wave is a proprietary momentum scoring system. It does not constitute investment advice. Past readings do not guarantee future performance. About Me and the Money Printer Me and the Money Printer is a daily publication covering the financial markets through three critical equations. We track liquidity (money in the financial system), momentum (where money is moving in the system), and insider buying (where Smart Money at companies is moving their money). Combining these elements with a deep understanding of central banking and how the global system works has allowed us to navigate financial cycles and boost our probability of success as investors and traders. This insight is based on roughly 17 years of intensive academic work at four universities, extensive collaboration with market experts, and the joy of trial and error in research. You can take a free look at our worldview and thesis right here. Disclaimer Nothing in this email should be considered personalized financial advice. While we may answer your general customer questions, we are not licensed under securities laws to guide your investment situation. Do not consider any communication between you and Florida Republic employees as financial advice. The communication in this letter is for information and educational purposes unless otherwise strictly worded as a recommendation. Model portfolios are tracked to showcase a variety of academic, fundamental, and technical tools, and insight is provided to help readers gain knowledge and experience. Readers should not trade if they cannot handle a loss and should not trade more than they can afford to lose. There are large amounts of risk in the equity markets. Consider consulting with a professional before making decisions with your money.
|


Subscribe to:
Post Comments (Atom)
0 Response to "Money Printer 302: The Number That Told Me Hell Was Coming"
Post a Comment