One Stock Is Up 12% This Year While The Market Falls Apart.

Trade of the Day Wake-Up Watchlist

"The setup earns the watch. The trigger earns the trade."

Nate Bear, Lead Technical Tactician, Monument Traders Alliance

Nate Bear

Publisher's Note: SpaceX could file for its IPO any day now.

When that happens, more will follow. Anthropic. OpenAI. Big names that have been private for years.

Most investors wait until these go public. By then the best gains could be gone.

On April 1 at 2 PM ET, CJ sits down with Matt Milner. Matt has direct exposure to more than 50 startups including SpaceX. He will walk through how to get in before the IPO window opens, where money is moving right now, and what most people get wrong about pre-IPO investing.

Join them here for our next MTA Live Event.

– Stephen Prior


The market is having its worst five-week stretch since 2022.

I am running the same system I run every week.

Right now I am watching MRK. That is Merck and Co, a $291 billion pharmaceutical company and a member of the Dow Jones Industrial Average.

It is up nearly 12% year to date while the S&P has been losing ground for five straight weeks.

I am not in it. But the chart is telling me something the rest of the market is not saying right now.

Here is why MRK has been bucking the selloff.

Merck's flagship is Keytruda, the world's best-selling cancer drug, which has continued to grow revenue even as growth stocks have been getting hit. They recently launched Winrevair for pulmonary hypertension, which gives the company a second major product beyond Keytruda.

The business generates over $18 billion in income on nearly $65 billion in sales. Gross margin is 74%. The forward P/E is 12.15, cheap for a company with those margins and EPS growth projected at 89% next year.

When the market turns defensive, institutions reach for names like this. Visible cash flow. Growing earnings. Healthcare demand that does not respond to oil prices or tariff headlines.

There is a known risk. Keytruda's patent expires in 2028. That is a real cliff.

But 2028 is two years away and the business is growing now. The chart reflects that.

Here is the full TPS read.

Buyers have been stepping in at every higher price.

mrk price chart
 

SPONSORED

Bad News About the Bitcoin Reserve

Former Presidential Advisor, Jim Rickards is out with a shocking new warning for investors.

“Forget about the Bitcoin Reserve.”

The U.S. Government currently holds $17 billion in Bitcoin.

But Rickards says, “The current Bitcoin Reserve is a rounding error compared to Trump’s next move.”

The reason, he says, is hidden in a recent Executive Order.

“Trump could soon release an asset worth an estimated $150 trillion. That’s enough to buy every Bitcoin in existence… along with a 100% stake in every stock traded on the NASDAQ and EVERY private home in the U.S.”

We recently sat down with Rickards – a 50-year insider who’s worked with several administrations from Nixon to Reagan to Trump – and asked him to explain his theory in detail.

If you’re an investor, you’re not going to want to miss this.

To watch the interview, free of charge, click here.

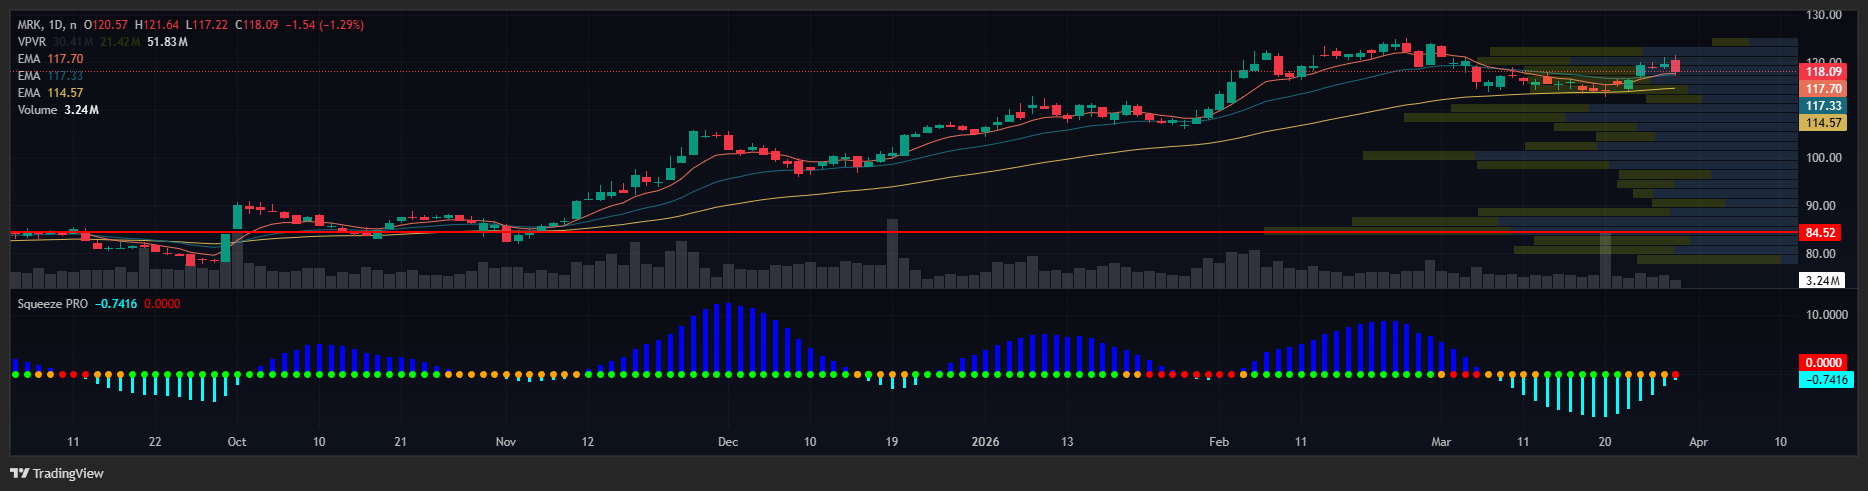
The 8-day EMA is at $117.64. The 20-day EMA is at $117.33. The price is above both. EMAs are stacked on the daily and weekly charts.

EMAs, or exponential moving averages, track the recent direction of a stock by weighting newer prices more heavily.

When shorter EMAs stack above longer EMAs, buyers have been consistently entering at higher levels over multiple timeframes. That is a trend.

The 200-day SMA, the long-term floor where institutions tend to defend positions, is at $95.80. That is 22% below the current price. MRK could give back a lot of ground and still be in an uptrend.

If MRK closes below the EMA 20 on volume, the trend read changes. That is my line.

The coil is loaded.

After running from $73 last year to the $117 range, MRK has been consolidating for several weeks. Tight range. EMAs catching up to price.

This is the setup before the setup. Consolidation after a trend move is how a stock loads energy before the next leg.

I am not interested in chasing this after it moves. I want to be positioned when it starts.

The consolidation has to hold. If it breaks down instead of up, I step away.

The squeeze is compressing.

Bollinger Bands are tightening inside the Keltner Channels on the daily chart. That is the squeeze.

Bollinger Bands measure how tight price movement has become relative to recent history. Keltner Channels measure a broader range based on average daily movement.

When the Bands compress inside the Channels, volatility has reached a coiling point. The release tends to match or exceed the move that preceded it.

The RSI is at 52. Not overbought. The squeeze fires with room to run.

When the squeeze fires in the direction of the trend, that is the highest probability setup I know.

MRK is refusing to follow the market lower.

The S&P is down five straight weeks. The Nasdaq is in correction. Most of the names on my list are sitting below their EMAs.

MRK is up nearly 12% year to date and up on the week. When a stock holds trend during a broad selloff, buyers are defending that name specifically.

It is not riding a rising tide. It is holding while the tide goes out.

Healthcare holds during uncertainty because people do not cancel prescriptions when oil goes above $100. That demand shows up in the chart before it shows up in the headlines.

Relative strength in a weak market is the filter. It tells me this name is worth the wait.

Your Action Plan

I have no position.

But the trigger is a clean close above the consolidation range on expanding volume. That is the squeeze releasing in the direction of the trend. The prior 52-week high at $125.14 is the first target.

If you do take this, I would place the stop below the 20-day EMA at $117.33. If MRK closes below that level on volume, the setup is done..

Entry condition. Target. Stop. These should all be defined before you place a single order.

If MRK seems like too slow a trade for you, I'm actively trading shorter term sets up my Daily Profits Live Room. Click here to learn more.

Want more content like this?
Like button Dislike button

SPONSORED

WARNING: These AI Stocks May Cause Massive Wealth

OXF Seven - May Cause Wealth pills
 

Side effects may include:

  • Checking your brokerage account obsessively
  • Screaming "I KNEW IT!" at your spouse
  • Googling "what to do with my fortune" at 3 a.m.

Because when Alexander Green - yes, the guy who nailed Nvidia at $1.10 per share split-adjusted - says he believes these 7 AI stocks are about to explode...

This isn't meme stock madness or crypto roulette.

It's seven real companies with trillion-dollar potential combined - but you must act before Wall Street fully catches on.

👉 Find out how to get the list before your barista retires before you.

Subscribe to receive free email updates:

0 Response to "One Stock Is Up 12% This Year While The Market Falls Apart."

Post a Comment