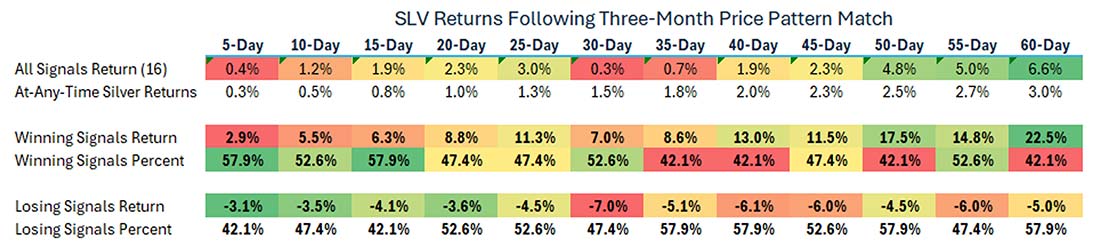
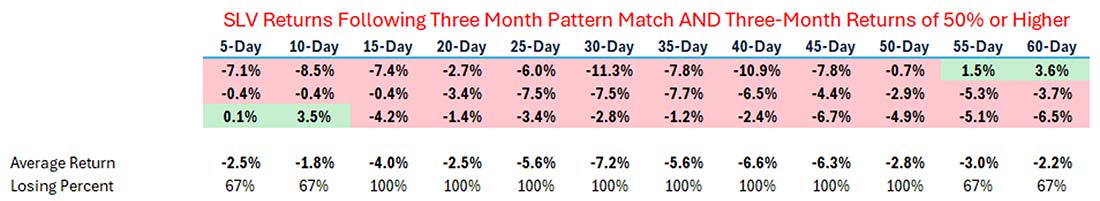
Chris "CJ" Johnson, Lead Host & Senior Analyst, Monument Traders Alliance Dear Reader, Silver has been one of the hottest trades out there... and for good reasons. But EVERY good trade either dies or takes a well-deserved rest. I always trust the numbers and prices to validate a large position or snap me back into reality. So I pulled the historical price data for the iShares Silver Trust (SLV) and dropped it into one of my trusty spreadsheets. Here's what the data told me... The Pattern Match Since SLV began trading, there have been 16 "matches" in its price pattern to what we've seen over the last three months. A "match" means any 63-day period that correlates with the last 63 days of closing prices for SLV shares. I used "natural log prices" for this comparison. This method prevents the absolute price level from skewing the pattern recognition. It generates four additional signals compared to unadjusted prices. In each of these 16 matches, SLV averages a return of 6.6% over the following 60 days. Those returns are more than twice the average at-any-time returns for SLV since inception. But that's not all the data is telling us... Three Key Findings First, the win rate is surprisingly low. Silver moves higher over the following 60-day period only 42% of the time. Yes, the current fundamental backdrop should support silver and other hard assets... but the numbers say a coin toss has better odds. Second - and here's the bullish case - the average losing return is only -5.5%, while the average winning return is 22.5%. When silver continues to rally... it does so in a robust fashion. The asymmetric payoff favors the bulls. Finally, when we narrow the criteria to periods with similar three-month returns (around 58%), the picture changes dramatically. | 


0 Response to "♟ How Long Can This Silver Run Last?"
Post a Comment