Keith Kaplan, CEO, TradeSmith Editor's Note: Today's issue comes from our long-time friend Keith Kaplan, the CEO of TradeSmith. In today's guest article, Keith shows traders the fundamentals of seasonality trading. He's also releasing a cutting-edge software that allows you to track a stock's seasonality patterns. You can try it yourself when you register for his Prediction 2026 event, which airs next Tuesday, January 20 at 10 a.m. ET. Go here to register for the event, so you can start testing the tool today. Then read on to learn what has Keith so excited... - Stephen Prior, Publisher
Dear Reader, Human progress didn't start with better tools. It started with better timing. Early humans paid close attention to repeating patterns in nature - the length of days, the return of floods, the timing of animal migrations. Those observations gave rise to the first calendars - sometimes recorded in stone, and often anchored to the predictable cycles of the sun, moon, and stars. This helped early farmers decide when to plant and harvest crops, and helped hunters know when herds would pass through a region. These cycles didn't explain why things happened. They explained when they happened. And that knowledge was enough to plan around. And when it comes to humanity's long fascination with cycles, few monuments are as widely studied as Stonehenge in southern England.  | | Stonehenge, a prehistoric monument near Salisbury in southern England | | |
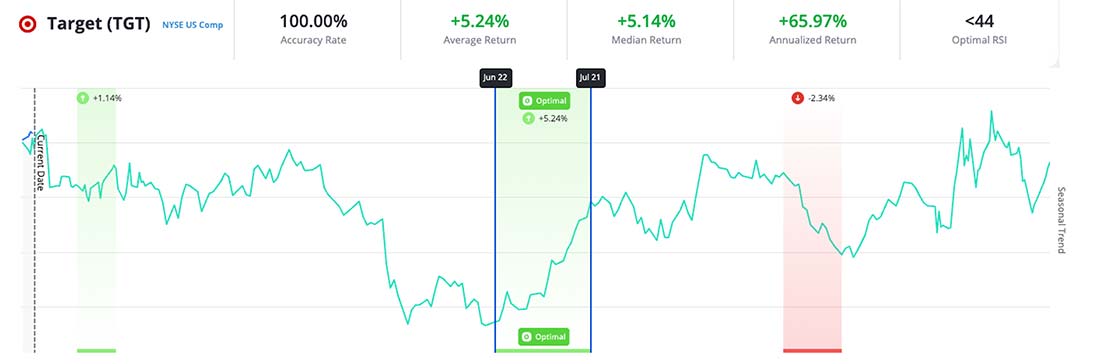
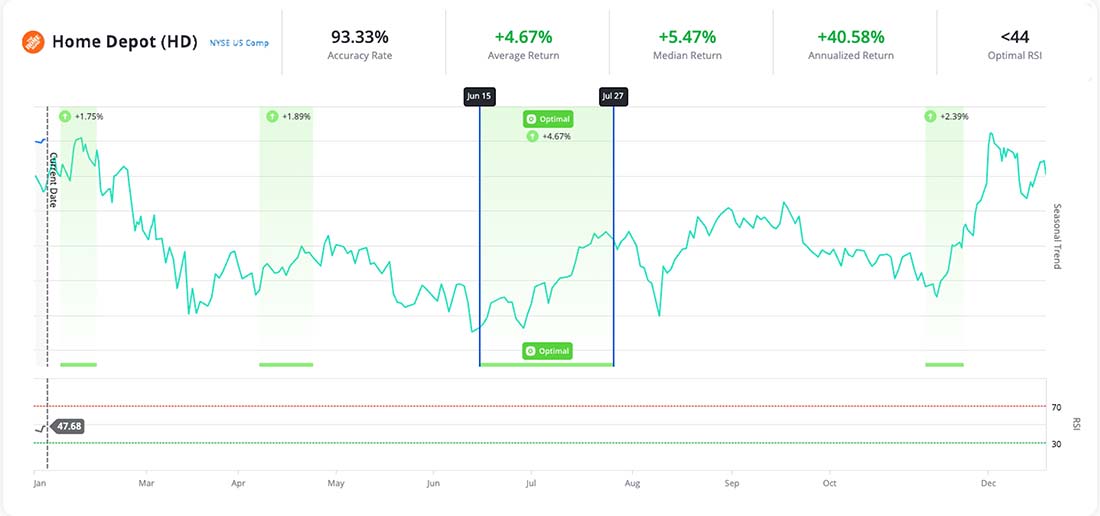
Built about 4,500 years ago in several phases, Stonehenge is among the best-known prehistoric monuments. One enduring theory about Stonehenge rests on its alignment. Its main axis points toward the sunrise on the summer solstice. That's led archaeologists to argue that Stonehenge was designed, at least in part, to mark key points in the solar year - signals that would have helped early societies anticipate seasonal change in a world where timing meant survival. Building a monument like this likely required generations of careful observation, tracking the sun's annual path using little more than fixed landmarks and sightlines. Today, we don't need to build huge stone structures to detect patterns that can help us thrive. We have more detailed data at our disposal and a lot more analytical power to help us put it all together. At TradeSmith, our mission is to give everyday investors access to the kinds of data and analytics once reserved for hedge funds. That work has led us to uncover a feature of the market that's often overlooked: seasonality in stock movements. The thing is, you can't see these cycles with the naked eye. They only show up after you run decades of data through powerful algorithms to look for them. But once you do, a surprising picture emerges. Thousands of stocks have historically reliable windows - specific times of year when they tend to rise and others when they tend to fall. That includes bull and bear markets, manias and panics, wars, pandemics, and more. How Seasonality Affects Markets Commodity traders, for example, have long tracked planting and harvest cycles in crops like corn and wheat. Energy traders watch seasonal demand shifts tied to winter heating and summer cooling. The gold market has recurring seasonal tendencies, often strengthening during certain parts of the year tied to jewelry demand, central bank buying, and annual festivals in India and China. And stock investors have studied phenomena like the "January Effect" for decades. Even Wall Street's old saying - "Sell in May and go away" - comes from observed seasonal behavior, not theory. But we've discovered that seasonality doesn't just apply just to commodities and the big stock market index. Every stock has its own seasons to rise or fall - a kind of summer and a kind of winter, too - year after year. Big-box retailer Target (TGT) provides a good example. As one of America's largest retailers, this stock moves with the rhythms of consumer spending throughout the year. But for all the money won - and lost - on Target over the last few years, there's one certainty... Between June 22 and July 21, you want to buy the retail bellwether. Because Target has moved up an average of 5.2% during that summer period, rising 100% of the time over the past 15 years... That's 15 years of summertime price spikes, starting long before it fell under the pandemic-era spotlight. And in 2025, the pattern held true: Target rose 10.3% during its 29-day seasonally bullish window. The chart you're seeing above is from one of the breakthrough innovations from TradeSmith's team of researchers, software engineers, and quant investors: our ground-breaking Trade Cycles Seasonality tool. It's an easy-to-use tool that can take one of thousands of commonly traded stocks, analyze its movements, and point out its strongest seasonality trends - with starting periods narrowed down to the day. Here's another example of a strong seasonality pattern, this time in Home Depot (HD)... Over the last 15 years, between June 15 to July 27, Home Depot's share price has risen 93% of the time, with an average return of 4.7%. And in 2025, the pattern held true again. It rose from $349.31 on June 16 to $372.69 on July 28 - a 6.7% gain in a just over a month. | 


0 Response to "♟ Cracking the Code of the Market's Seasonal Cycles"
Post a Comment