Chris "CJ" Johnson, Lead Host & Senior Analyst, Monument Traders Alliance Dear Reader, I talk about how things were "back in the day" a lot, but this week's market activity has me thinking about some very specific events and "conspiracies." The kinds of things a trader never forgets, because they are usually signs of what's coming next. And they're usually things we want to avoid. I've had that feeling lately. It's tied to events that happened in 2000 and again in 2008. You know those time periods and how they ended. That vibe I'm feeling right now all starts with one question... Is someone meddling with stock prices? Is Someone Meddling With Stock Prices? Just lean in for a minute and hear me out. I'm not a conspiracy theory guy. But I do pay attention when the market starts behaving in ways that don't make sense. Let's talk about the PPT. The Plunge Protection Team (PPT) is the informal name for the President's Working Group on Financial Markets. This government body was created after the 1987 Black Monday crash to help maintain stability in U.S. financial markets. The group brings together leaders from the Treasury, the Federal Reserve, the Securities and Exchange Commission, and the Commodity Futures Trading Commission - the pillars of the market's regulatory framework. Officially, the group exists to coordinate policy responses during periods of severe financial stress. That includes monitoring market conditions, ensuring liquidity in the banking system, and preventing systemic breakdowns that could threaten the broader economy. But let's be honest about how markets actually work. While the PPT does not publicly acknowledge direct intervention in equity markets, its members control many of the levers that influence market stability. Liquidity injections, emergency lending programs, regulatory adjustments, and coordination with major financial institutions are all tools available to them. And in moments when markets begin to spiral lower, those tools can produce the same effect as direct buying. Think about it. Nothing makes investors feel better than a sudden burst of "buy the dip" activity. It reassures the crowd that everything is fine. The reality is that the PPT is a legitimate institution with a legitimate mandate. But it's also difficult to ignore that modern administrations increasingly treat rising stock prices as a political and economic success metric. When markets wobble, the incentive to quietly stabilize them is enormous. Whether through policy, liquidity, or coordination, the result often looks the same - a market that suddenly finds support just as instability begins to threaten the system. And that brings me to what has my attention. Did the PPT Ring the Dow 50,000 Bell? In late December, the Federal Reserve injected liquidity into the banking system through its overnight lending window. It was the largest liquidity injection since the COVID-19 crisis. The timing is what stands out. The move occurred within four days of the S&P 500 reaching new all-time highs and just two days before the Dow Jones Industrial Average moved within 1% of the 50,000 level - a milestone widely promoted as proof of a strong economy. Yet the Fed felt the need to inject the largest amount of liquidity since the pandemic. That raises a simple question about the real health of the system that supposedly produced Dow 50,000. Just saying. Is the PPT trying to get you to buy the dip? This is one of the reasons that "buy the dip" is starting to fail. The PPT doesn't want to follow through on their buying, just get the buying started so investors like you and I will take over when we think that everyone else is buying. I've seen it before, and we'll certainly continue to see it over the next year. Next, Markets Can Remain... "The market can remain irrational longer than you can remain solvent." That famous quote is attributed to John Maynard Keynes, and it's one of the most repeated lines in finance. Most investors interpret it as a warning to anyone betting against a rising market. But Keynes' quote cuts both ways. Right now, we're seeing credible threats to the underlying structure of the market. - Economic signals are deteriorating.
- Geopolitical risks remain elevated.
- Market leadership is breaking down.
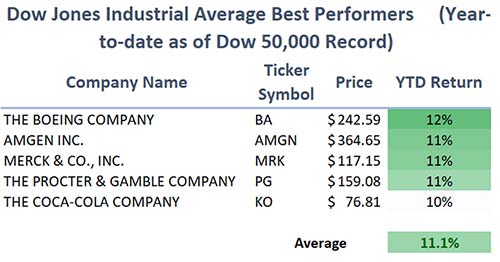
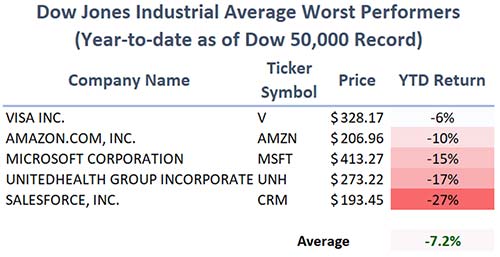
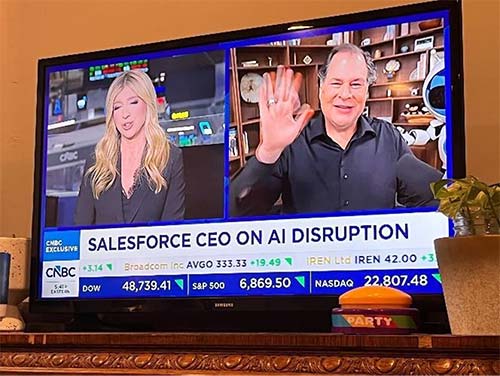
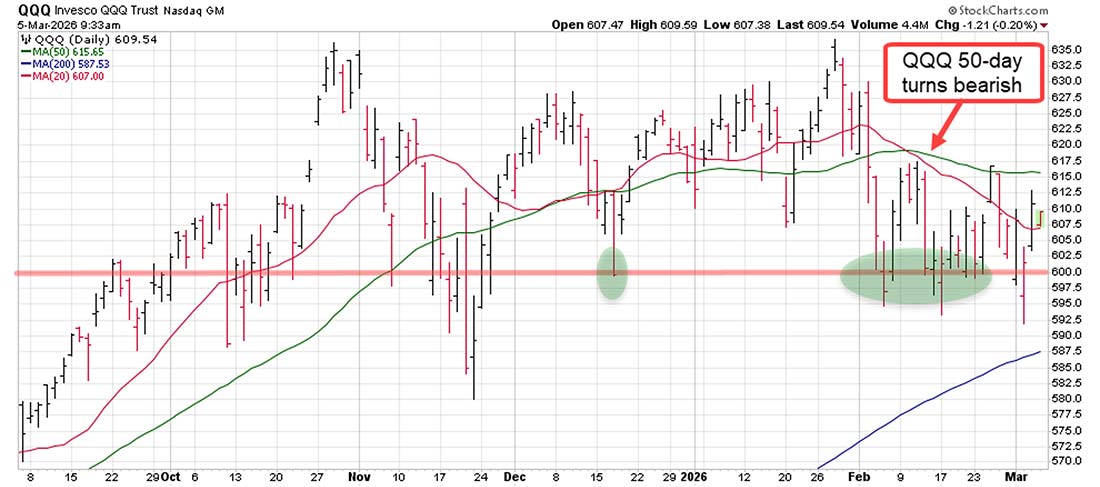
Yet investors continue behaving as if everything is fine. Dare I say... irrationally? Just look at what stocks have done over the past two months. The S&P 500 has traded inside a tight 3% range, an unusually narrow band considering the number of macro risks currently in play. The Nasdaq 100, Wall Street's favorite index for its heavy technology weighting, has quietly entered an intermediate-term bear trend. The Dow Jones Industrial Average tells an even stranger story. Yes, the Dow pushed above 50,000 on February 10. But look at the leadership that made it happen. The top five performers at that point were 3M (MMM), Caterpillar (CAT), Cisco (CSCO), Honeywell (HON), and Amgen (AMGN). Solid companies, sure. But hardly the kind of growth engines that typically drive a sustained bull market. These are better described as safety stocks. Meanwhile, the worst performers were Salesforce (CRM), UnitedHealth (UNH), Microsoft (MSFT), Amazon (AMZN), and Visa (V). Those are the companies investors actually recognize, not safety trades, and they're the ones that are dragging the market lower. That, my friends, is irrationality. Now let's go back to what Keynes said. "The market can remain irrational longer than you can remain solvent." Right now, the irrationality is that investors believe the market is healthy. They're whistling past the graveyard. That specific phrase brings back memories for me. I used it frequently during my weekly CNBC interviews in 2007 as warning signs ahead of the financial crisis began appearing. And here I am, literally watching Marc Benioff on CNBC live as I type this, smiling and waving to the crowd while talking about Salesforce's bright outlook. This display happened just moments after he said "I can't really understand it" about the sell-off in software. Meanwhile, Salesforce shares are down roughly 27% year-to-date, making it one of the worst-performing large software stocks. Sidenote: Yes, that is a "30-Second Dance Party" button next to the TV. I encourage everyone to have one in their house as a great way to take a break from this irrational insanity. That CNBC interview and optics matter for two reasons. First, software companies are being punished because Wall Street increasingly expects them to be among the first to miss revenue and earnings targets if corporate spending slows during a pause in the AI boom. Second, the optimism emanating from executives feels dangerously disconnected from what the market is actually doing. The lesson here... Irrationality works both ways. Right now, investors are irrationally optimistic about the market's health. If that sentiment shifts - and it can happen quickly - we could be just a few headlines away from that irrationality turning against the bulls. When that happens, prices don't drift lower. They reprice quickly as everyone realizes they've been whistling past the graveyard. | 


0 Response to "♟ Dow 50,000 Wasn't Supposed to Happen Like This"
Post a Comment