This Chart Was Already Screaming Before the War Started

Trade of the Day Wake-Up Watchlist

"A squeeze without a trigger is just a stock I am monitoring."

Nate Bear, Lead Technical Tactician, Monument Traders Alliance

Nate Bear

Every trader I know is watching the Middle East right now.

Israel struck Iran's South Pars natural gas facility yesterday. The largest in the world. Brent crude jumped to over $108 a barrel. The Strait of Hormuz is effectively closed. Qatar's LNG exports are disrupted. European gas prices are up 63% since the conflict began.

The headlines are moving energy stocks in every direction. Traders are buying on missile strikes and selling on ceasefire rumors. Reacting. Chasing. Making decisions based on what they just read.

That is not how I trade.

The stock I am watching right now is Kinder Morgan. Ticker KMI. One of the largest energy infrastructure companies in North America. And while every trader is reacting to Middle East headlines, this chart has been telling a completely different story for weeks.

What the chart was already telling me.

Before the Iran war. Before the headlines. Before the spike in oil prices.

KMI had stacked EMAs on both the daily and the weekly. EMAs - exponential moving averages - are lines that track the average price of a stock over a set period, weighted toward recent prices.

When shorter EMAs sit above longer ones, it means buyers have been consistently stepping in at higher prices over time. That is a healthy uptrend, not a news-driven spike.

The 200 SMA - a simple moving average that tracks the average closing price over the last 200 days - was holding as support below the stock. That is the level where big institutional money tends to step in and defend a position. KMI was sitting above it cleanly.

The stock is up roughly 20% while the broader market is flat. That is relative strength - when a stock outperforms a weak or sideways market, it tells you there is real conviction behind the move. Not momentum chasers. Money that has done its homework.

And now we have a daily squeeze. A squeeze happens when Bollinger Bands - a measure of how much a stock's price is fluctuating - contract inside Keltner Channels, which measure a stock's average trading range.

When the bands tighten inside the channels, volatility has compressed. The stock is coiling near the 52-week high of $34.34, with the stock sitting around $33.

kmi stock chart
 

SPONSORED

A Historic Gold Announcement Is About to Rock Wall Street

For months, sharp-eyed analysts have watched the quiet buildup behind the scenes. Now, the floodgates are set to open. The greatest investor of all time is about to validate what Garrett Goggin has been saying for months: Gold is entering a once-in-a-generation mania. Front-running Buffett has never been more urgent and four tiny miners could be your ticket to 100X gains.

Be ready before the historic gold move. Get Garrett’s Top Four picks now.

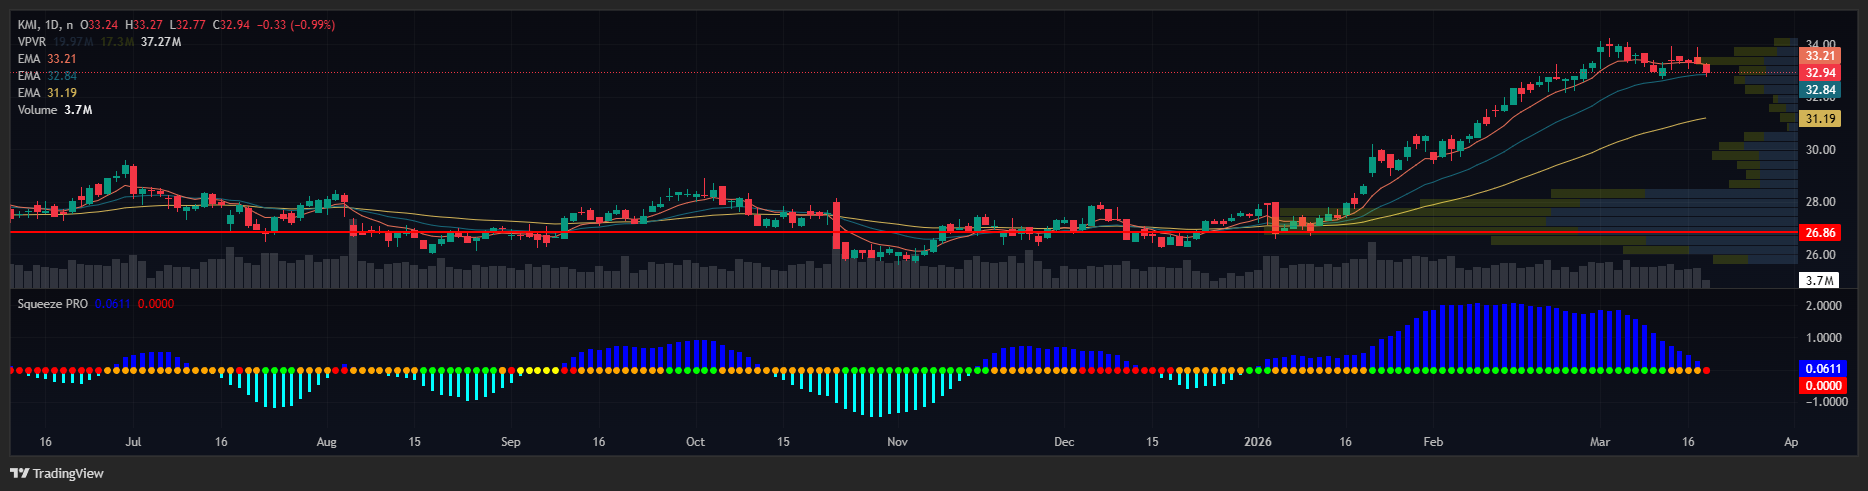
The business behind the chart.

Kinder Morgan operates roughly 66,000 miles of pipeline and moves nearly 40% of all natural gas consumed in the United States. It does not produce gas. It moves it. On long-term take-or-pay contracts - meaning customers commit to paying for pipeline capacity whether they use it or not.

Almost two-thirds of EBITDA - earnings before interest, taxes, depreciation, and amortization, a measure of operating profitability - is fee-based and largely insulated from commodity price swings.

The Iran war does not directly touch that business. But it strengthens the long-term case. Europe needs US LNG more than ever. AI data centers still need power. More than 50% of KMI's $9.3 billion project backlog is targeting data center power generation. That backlog grew by $6 billion in the last 12 months.

In January, KMI beat adjusted EPS estimates by over 8%. Revenues jumped 13% year-over-year to $4.51 billion. Record annual net income. Eighth consecutive year of dividend increases.

The business was already inflecting before the geopolitical noise arrived.

The trend. The pattern. The squeeze.

Trend first. Always. Stacked EMAs daily and weekly. Institutional support on the 200 SMA. Relative strength against a flat market. This is not a stock fighting its trend. It is a stock being carried by one.

Pattern second. After the January earnings run, KMI coiled. Tight consolidation near the 52-week high. Not giving much back. That is spring loading, not distribution.

Squeeze third. Bollinger Bands contract inside Keltner Channels on the daily. Volatility compressed. The tape is loaded.

All three conditions are present. That is the TPS setup - Trend, Pattern, Squeeze. In that order, every time.

No trigger, no trade.

I do not yet have a position in KMI. I am watching, not trading.

The trigger I need is a clean daily close above $34.34 on volume. That tells me the compression has resolved and the next move is underway. Until that happens, KMI stays on the watchlist. A squeeze without a trigger is just a stock I am monitoring.

If the trigger fires, I will be looking at the EMA 20 - the 20-day exponential moving average - as my stop. A clean close below that level on volume means the thesis is wrong. Exit defined before the entry. That is non-negotiable.

What would prove this wrong?

Two things would change my read. First, if the broader energy sector rotates hard on a ceasefire, traders who bought on Iran headlines will sell all at once, taking KMI with them.

Your Action Plan

This is a setup I am watching, not a trade I am in.

Keep KMI on your radar. The trend is intact. The pattern is tight. The squeeze is loaded. The business has real structural tailwinds that existed before today's headlines and will exist after them.

The traders reacting to every missile strike are creating noise. The chart is cutting through it.

When the trigger fires, I will be ready. Until then, I wait.

If you want to see how I build full positions around setups like this one - a specific entry and a defined stop - that is what Daily Profits Live is built for. Check it out here.

Want more content like this?
Like button Dislike button

SPONSORED

Are you a long-term investor? You'll Want to Hear This...

The President of the United States once went to bat for an American energy company that's merging energy and AI.

It's wildly cheap, and one man believes it could be the long-term answer to our AI energy needs.

Click here to unlock details on this value play.

Subscribe to receive free email updates:

0 Response to "This Chart Was Already Screaming Before the War Started"

Post a Comment