|
Gold and Silver Are Testing Their 2026 Lows
|
|
Gold and silver were one of the hottest trades entering 2026. As we head toward the end of the year, precious metals are losing their shine.
|
|
Gold currently sits 28% below the high made in January. Silver is down 58% from its January peak.
|
|
But last month, I told you to be on the lookout for a chart signal that could mark a bottom. I had this to say about silver back in October:
|
|
|
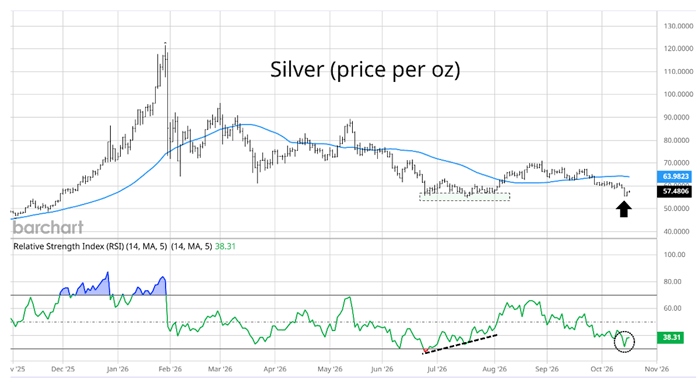
We can also look for technical clues that downside momentum is fading, similar to the summer lows. Look at the silver chart for an example of what to watch:
|
|
|
|
|
|
During the lows over the summer months, silver tested the $56 per ounce area several times. The Relative Strength Index (RSI) made a series of higher lows. That showed downside momentum was fading, which led to a reversal higher.
|
|
Silver is once again testing the same level right as the RSI nears oversold territory. The setup in gold prices is very similar. Ideally, silver and gold will test support while the RSI makes another positive divergence with higher lows.
|
|
That would help set the stage for another reversal higher in precious metals.
|
|
|
|
Following that chart analysis last month, the RSI dropped into oversold territory for both silver and gold.
|
|
And right on cue, a similar pattern to the summer months is starting to take shape. Here’s the trading signal to watch for next.
|
|
Tune in to Trading With Larry Live

Each week, Market Wizard Larry Benedict goes live to share his thoughts on what’s impacting the markets. Whether you’re a novice or expert trader, you won’t want to miss Larry’s insights and analysis. Even better, it’s free to watch.
Visit us on YouTube to catch the latest!
|
|
|
The RSI Signal That Could Mark a Bottom in Gold and Silver
|
|
During the pullback in late October, gold and silver both took out their summer levels and dropped to new lows on the year.
|
|
The RSI for each metal fell to oversold levels, which helped produce a rally. But as interest rates and the dollar are rising, gold and silver are testing the late October lows. In doing so, it could generate the next trading signal.
|
|
This time, let’s take a look at the gold chart.
|
|
|
|
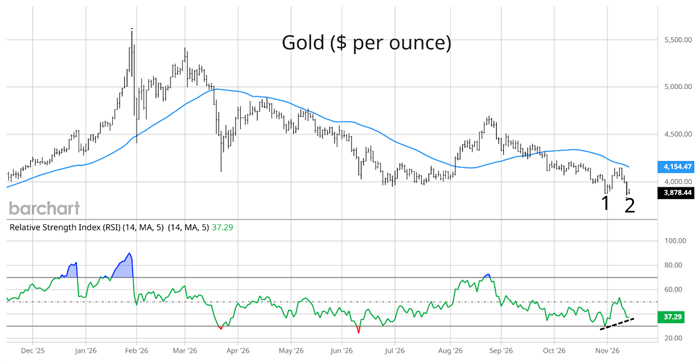
Gold fell to new lows on the year at “1,” which saw the RSI briefly drop below 30. The oversold condition sparked a rally to start November, but prices are rolling back over to test the lows at “2.”
|
|
As gold tests the lows, notice that the RSI is making a higher low (dashed line). That’s a positive momentum divergence that shows downside momentum is fading. The silver chart shows something very similar.
|
|
Just like the summer months, the RSI is starting to make a positive divergence for gold and silver. That could set the stage for a relief rally in precious metals.
|
|
We’ll keep a close eye on both SPDR Gold Trust (GLD) and iShares Silver Trust (SLV) for potential options trades as these moves play out. The right setup could hand traders some solid profits.
|
|
Happy Trading,
|
|
Larry Benedict
Editor, Trading With Larry Benedict
|
|
P.S. Tomorrow is your last shot to catch the replay of last week’s Penny Tech Profits event. Jeff Brown and I sat down to dig into the prediction markets space… and show why each of us is so excited about the opportunities we see there.
|
|
My readers had the chance to grab a 233% win last week… giving us a 92% win rate since I started sharing these trades.
|
|
|
|
|
|
Get Instant Trade Alerts on Mobile!
|
|
|
|
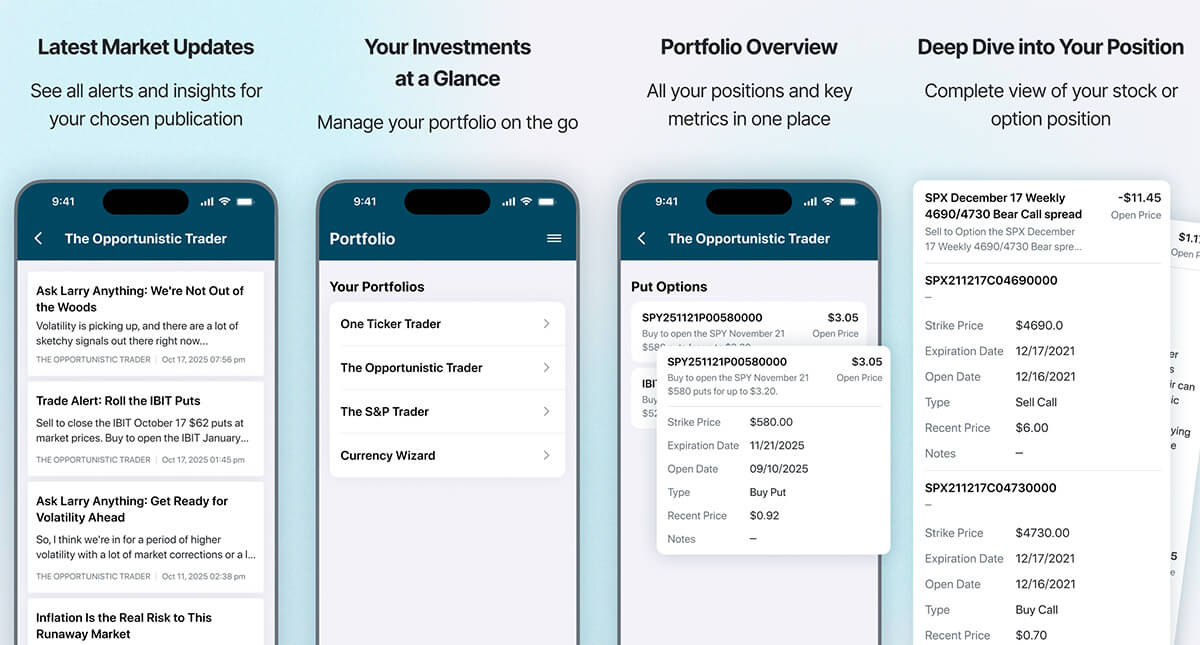
Click the icon below from your mobile device to download The Opportunistic Trader app today for one-tap access to trade alerts, issues, and model portfolios for all of Larry’s services.
|
|
Available in the app store on Android and iPhone.
|
|
|
|
|
|
|
More stories like this
|
|
Read the latest analysis on hot growth stocks, and market-moving developments
|
|
|
|
|
|
|
|
|
|
To ensure our emails continue reaching your inbox, please add our email address to your address book.
This editorial email containing advertisements was sent to penunggangbadai.moneyblog@blogger.com because you subscribed to this service. To stop receiving these emails, click here.
The Opportunistic Trader welcomes your feedback and questions. But please note: The law prohibits us from giving personalized advice.
To contact Customer Service, call toll free Domestic/International: 1-888-208-6550, Mon–Fri, 9am–5pm ET, or email us here.
© 2026 Omnia Research, LLC. All rights reserved. Any reproduction, copying, or redistribution of our content, in whole or in part, is prohibited without written permission from Omnia Research, LLC.
|
|
|
|
|














0 Response to "Gold and Silver Bottom? Watch This RSI Signal"
Post a Comment