|
Semiconductors Have Stalled Since June
|
|
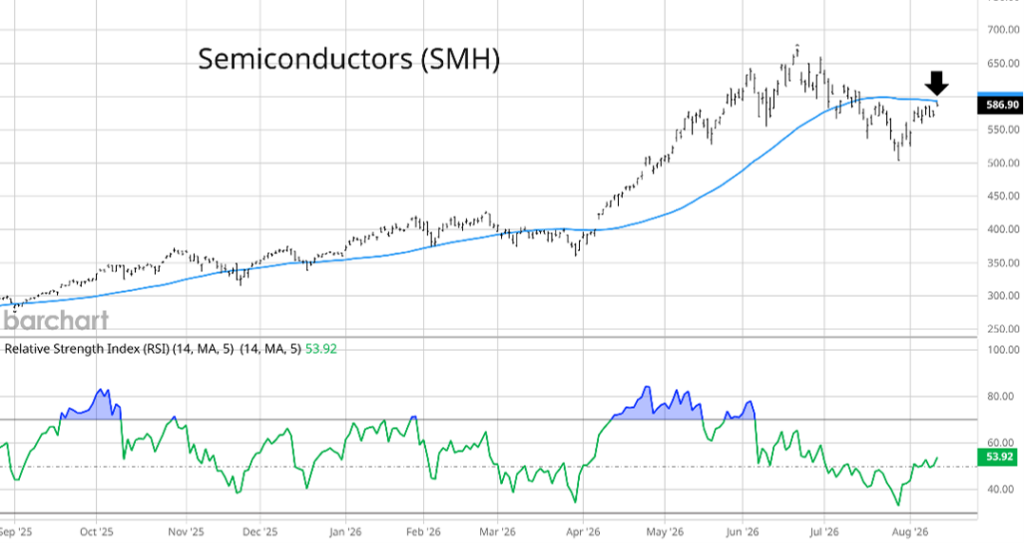
Ever since late June, the VanEck Semiconductor ETF (SMH) has been struggling for traction.
|
|
Holdings in SMH include AI infrastructure stalwarts and companies seeing a direct benefit from AI capex. That includes names like Nvidia (NVDA), Advanced Micro Devices (AMD), and Micron Technology (MU).
|
|
Those stocks helped power a massive SMH rally in a short time. Heading into the June peak, it had gained 84% in less than three months.
|
|
|
|
|
A subsequent pullback in SMH took the ETF lower by 25%, which retraced about 50% of the entire rally since April.
|
|
While the RSI didn’t quite extend to oversold territory below the 30 level, it fell to the lowest level since the selloff in April 2025 following the trade war. That sparked a rebound off the $500 level, which has the next big test in play.
|
|
|
The bounce off the $500 level now has SMH pushing up against the 50-day MA from below at the arrow, which gives us the next big test to monitor. It’s common to see key support or resistance levels tested following a break… only for the trend to resume.
|
|
|
|
|
|
|
So if SMH stalls out below the 50-day, then watch for the $500 support level to come into play once again.
|
|
|
|
SMH did indeed stall out at the 50-day in the chart shown above, but it led to a shallow pullback instead of a deeper drop to test the $500 level.
|
|
Now in the aftermath of the Fed and growing AI concerns, a bearish setup is presenting itself once again.
|
Tune in to Trading With Larry Live 
Each week, Market Wizard Larry Benedict goes live to share his thoughts on what’s impacting the markets. Whether you’re a novice or expert trader, you won’t want to miss Larry’s insights and analysis. Even better, it’s free to watch. Visit us on YouTube to catch the latest! |
|
|
The 50-Day Moving Average Is the Battleground
|
|
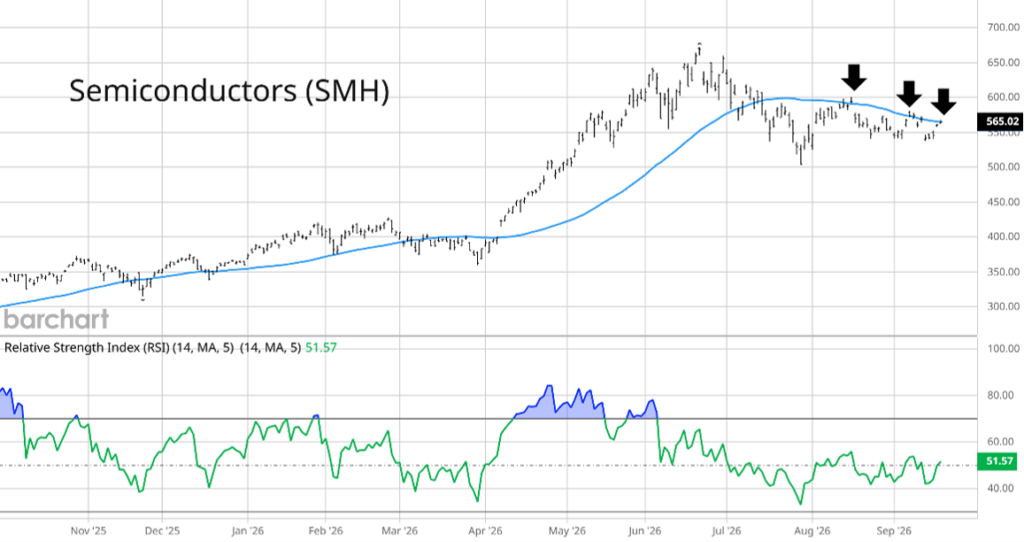
Semiconductor stocks keep struggling at a key level. Following the test of the 50-day MA back in August, SMH has again rejected that resistance level. Now it is testing it once again.
|
|
Take a look at the updated chart:
|
|
|
|
Since the test in August, SMH has come back to the 50-day MA two more times at the arrows.
|
|
The good news for bulls is that each rejection has led to a shallow pullback. That shows buyers are quick to step in on any weakness.
|
|
But SMH is having a hard time sustaining any upside momentum. That shows a stalemate between the bulls and the bears.
|
|
The 50-day continues to be a key battleground level. I believe the risk of a larger downside move in SMH becomes bigger with each failed attempt at the 50-day.
|
|
That’s why the 50-day MA remains the level to watch for this potential trade. We may soon see whether or not the AI trend has the legs to continue… or whether that massive rally is finally ready to break.
|
|
Regards,
|
|
Larry Benedict
Editor, Trading With Larry Benedict
|
|
|
Get Instant Trade Alerts on Mobile!
|
|
|
|
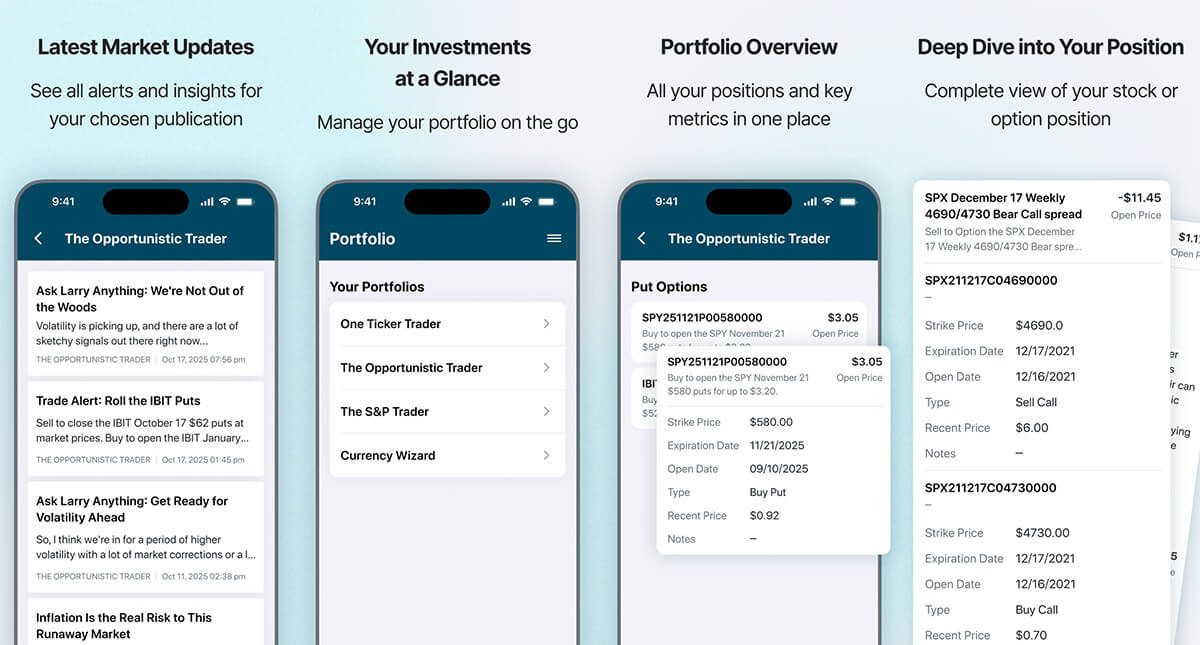
Click the icon below from your mobile device to download The Opportunistic Trader app today for one-tap access to trade alerts, issues, and model portfolios for all of Larry’s services.
|
|
Available in the app store on Android and iPhone.
|
|
|
|
|
|
More stories like this
|
|
Read the latest analysis on hot growth stocks, and market-moving developments
|
|
|
|
|
|
|
|
To ensure our emails continue reaching your inbox, please add our email address to your address book.
This editorial email containing advertisements was sent to penunggangbadai.moneyblog@blogger.com because you subscribed to this service. To stop receiving these emails, click here.
The Opportunistic Trader welcomes your feedback and questions. But please note: The law prohibits us from giving personalized advice.
To contact Customer Service, call toll free Domestic/International: 1-888-208-6550, Mon–Fri, 9am–5pm ET, or email us here.
© 2026 Omnia Research, LLC. All rights reserved. Any reproduction, copying, or redistribution of our content, in whole or in part, is prohibited without written permission from Omnia Research, LLC.
|
|
|
|
|















0 Response to "This Semiconductor Chart Level Is the Key to the AI Trade"
Post a Comment